Self-Hosting Your Own Analytics: Plausible on a VPS, and What It Actually Costs
On this page, 9 sections
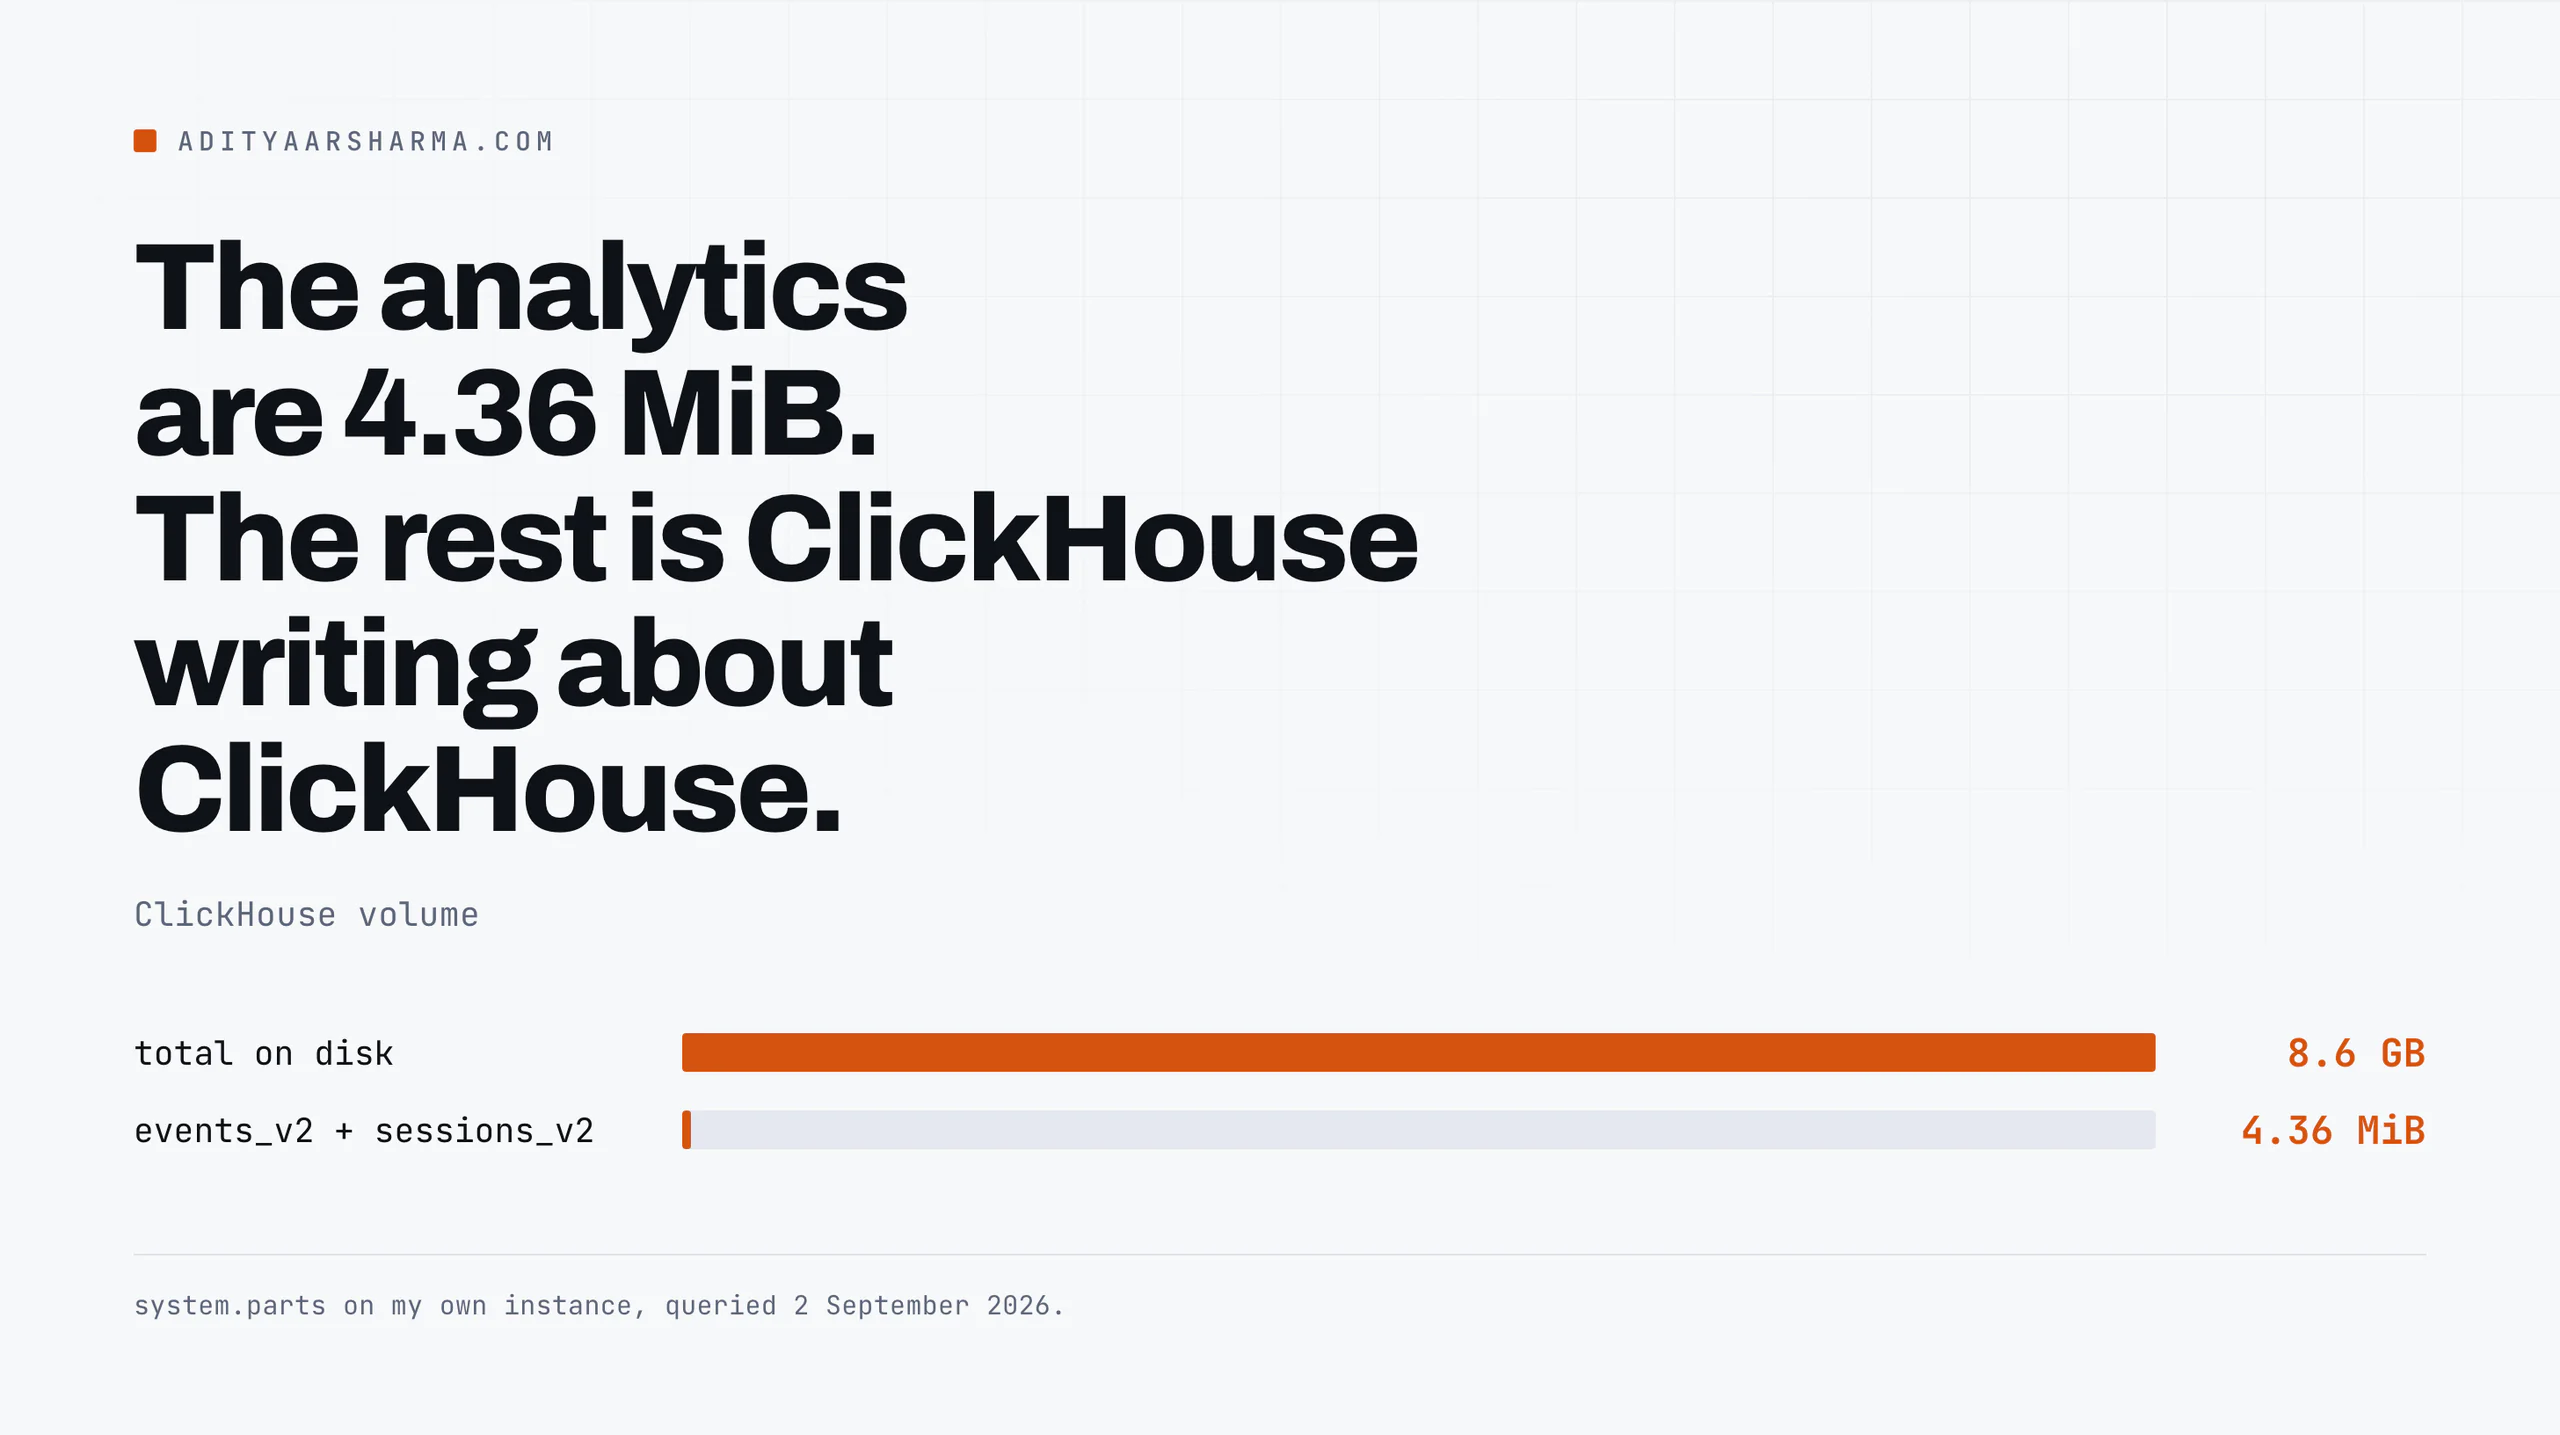
I ran du -sh against the ClickHouse volume behind my self-hosted Plausible install this morning and got 8.6G. The site it measures gets a few hundred pageviews a day. So I asked ClickHouse what was actually in there.
SELECT database, table,
       formatReadableSize(sum(bytes_on_disk)) AS size,
       sum(rows) AS rows
FROM system.parts WHERE active
GROUP BY database, table
ORDER BY sum(bytes_on_disk) DESC
Run it with docker exec <container> clickhouse-client --query.

system.parts on my own instance, queried 2 September 2026.The analytics I wanted are the bottom two rows. events_v2 plus sessions_v2 is 4.36 MiB. Everything above them is ClickHouse writing telemetry about ClickHouse.
Call it 8.3 GB of self-description for 4 MiB of pageviews, accumulated on a box that uptime reports as up 121 days (run 2 September 2026).
This is not a ClickHouse bug and it is not a Plausible bug.
It is what you get when you assemble the stack from a tutorial instead of from Plausible’s own reference compose file, because that file mounts a ClickHouse config which switches those tables off and mine does not mount it.
I checked, and the missing file is mine.
The compose file Plausible actually ships
Plausible Community Edition has its own repository at github.com/plausible/community-edition.
The current tag is v3.2.1 and the README tells you to clone that exact tag rather than the default branch (read 2 September 2026): git clone -b v3.2.1 --single-branch https://github.com/plausible/community-edition plausible-ce.
The repository holds four things, a clickhouse/ directory, compose.yml, the licence and the README.
The three images it pins
Three images, with the tags the project pins itself:
postgres:16-alpine, the application database (users, sites, settings)clickhouse/clickhouse-server:24.12-alpine, the event storeghcr.io/plausible/community-edition:v3.2.1, Plausible itself
The block every third-party writeup drops
And here is the block that goes missing from every third-party writeup I have read. It is the volumes: list on the ClickHouse service:
plausible_events_db:
    image: clickhouse/clickhouse-server:24.12-alpine
    volumes:
      - event-data:/var/lib/clickhouse
      - event-logs:/var/log/clickhouse-server
      - ./clickhouse/logs.xml:/etc/clickhouse-server/config.d/logs.xml:ro
      - ./clickhouse/ipv4-only.xml:/etc/clickhouse-server/config.d/ipv4-only.xml:ro
Four bind mounts. Drop them and the container still starts, still serves, still records pageviews correctly. Nothing tells you anything is wrong for about six months.
What logs.xml does, and why it matters
The whole file is 828 bytes. It sets the logger level to warning with console output on, then redefines query_log, trace_log, asynchronous_metric_log and metric_log with replace="1", a 7500 millisecond flush interval and a TTL on each.
Why the logs grow and the events do not
The mechanism is worth understanding because it explains the shape of my 8.6 GB exactly. ClickHouse merges every XML file it finds in config.d/ into one configuration tree.
remove="remove" deletes that node from the merged tree, so the table is never created and the background thread that feeds it never starts.
replace="1" on query_log swaps the default definition for one carrying TTL event_date + interval 30 day, so query history is kept for a month and then the parts are dropped whole.
Without the file, ClickHouse defaults apply and none of those tables have a TTL. asynchronous_metric_log samples several hundred server metrics on a fixed interval and appends a row per metric per sample, forever.
That is where 5,440,544,186 rows came from on a site nobody visits much. Nothing prunes it, because nothing was told to.
How I dated my own install
My instance went up on 27 October 2025. I can date it because the one-shot plausible-run-* containers from that first docker compose run are still in docker ps -a with a 2025-10-27 start time, and because I published the walkthrough the same day.

That is my own video, “How to Self-Host Plausible on VPS with RunCloud – Google Analytics Alternative!”, on the Aditya Sharma channel, published 27 October 2025.
It covers the RunCloud side: creating the web application, pointing the domain, and putting the reverse proxy in front of port 8000.
It does not cover the ClickHouse config files, which is the gap this post exists to close.
The RAM numbers, theirs and mine
The Plausible CE README states two hardware prerequisites in plain text.
The CPU must support the SSE 4.2 or NEON instruction set, which is a ClickHouse requirement and rules out some older and some very small ARM instances.
And: at least 2 GB of RAM is recommended for running ClickHouse and Plausible without fear of OOMs.
My ceilings, and what they hold
My compose sets ceilings below that, deliberately, because the box runs other things:
plausible: memory limit 512Mclickhouse: memory limit 512Mdb: memory limit 256M
Total 1.25 GB against a recommended 2 GB. Here is what those containers were actually holding when I checked, from docker stats --no-stream on 2 September 2026:
aditya-analytics-plausible-1: 116.5MiB of 512MiB, 22.75 per centaditya-analytics-clickhouse-1: 318.9MiB of 512MiB, 62.28 per centaditya-analytics-db-1: 58.37MiB of 256MiB, 22.80 per cent
ClickHouse sitting at 62 percent of a ceiling the vendor says should be higher is the line I would watch. docker inspect shows that container has restarted five times.
State.OOMKilled is false for the current run, so I cannot claim those restarts were memory pressure, and I am not going to.
What I can say is that the headroom is thin and the project told me it would be.
The number on the host that is worse
The other number on that host is worse. free -m reports 7,750 MiB of RAM with 4,386 in use, and swap at 1,808 MiB of 2,047.
That is a machine already leaning on disk, which is the state in which an unexpected 3 GB log table stops being a curiosity.
What the VPS costs, from a page that renders
I wanted to quote Hetzner here because that is where this box lives.
Their price grid is injected client-side, so it does not appear in the HTML a crawler receives, and I am not going to type a number I could not read from the source.
DigitalOcean publishes the same class of machine on a server-rendered page, so that is the table I can show you.

- 2 GiB / 1 vCPU / 50 GiB SSD: $12.00 per month
- 4 GiB / 2 vCPUs / 80 GiB SSD: $24.00 per month
- 8 GiB / 4 vCPUs / 160 GiB SSD: $48.00 per month
Reading the price grid
The $12 line meets the 2 GB the README asks for and nothing more. If the box does one job, that is the honest entry price.
Mine runs seven containers, including a self-hosted crawler and search stack, so it sits well above that line, which is exactly why the marginal cost of adding Plausible to it felt like zero and why the 8.6 GB went unnoticed for ten months.
Disk is the quiet part
Disk is the quiet part. df -h / on my host shows 150G total with 73G used. The ClickHouse volume is 8.6G of that, and it grew without any event volume growing.
If you size a $12 Droplet at 50 GiB and forget the logs config, you have a slow-motion disk-full incident scheduled for some point in year four.
Against Plausible Cloud, honestly

At the default slider position of 10,000 monthly pageviews, Plausible Cloud is $9 a month for Starter (one site, 3 years of retention), $14 for Growth (3 sites), and $19 for Business (10 sites, 5 years of retention, Stats API at 600 requests per hour).
Annual billing on the same page shows $90, $140 and $190.
Where Cloud wins
So for one small site, Cloud costs less than a dedicated $12 Droplet the moment you price an hour of your own time into the self-hosted side. Say that plainly, because most self-hosting posts will not.
Plausible is AGPL-3.0 and the company funds the community edition from cloud subscriptions, which they say on the repository page.
Where self-hosting wins
Self-hosting starts winning in three situations, and only three that I can defend:
- The server already exists for other work, so the marginal cost is disk and RAM rather than a new bill.
- You want raw event data. Cloud lists scheduled raw event exports under Enterprise; self-hosted gives you a ClickHouse client and a
SELECT. - You want retention longer than five years, or no pageview meter at all.
If none of those apply, pay the $9. That decision is closer to the one I wrote about in who pays for WordPress plugin subscriptions on client sites than it is to a technical argument.
I put the whole ledger, including backups and the hours, in what self-hosting actually costs against the SaaS you are replacing.
The tag drift I found while writing this
One more thing that fell out of the check. My compose file pins ghcr.io/plausible/community-edition:v3.2.1. The running container reports something else: docker inspect -f '{{.Config.Image}}' aditya-analytics-plausible-1 returned ghcr.io/plausible/community-edition:latest, and docker image inspect --format 'created={{.Created}}' dated that image 2026-05-15T09:20:21Z.
A pinned tag you never applied is not a pin
The file and the running process disagree. Editing a tag in compose.yml changes nothing on its own; the container keeps the image reference it was created with until docker compose up -d recreates it.
So the pin is aspirational until you run the command, and the layer currently serving my analytics was built in May.
If you self-host anything, that two-line check is worth putting in a cron. A pinned tag you never applied looks exactly like a pinned tag you did.
If you run this across client sites rather than one of your own, that check belongs in the same routine as everything else in managing WordPress sites for clients.
The fix, which I have not run yet
Adding the config is three steps. Truncating what has already accumulated is a write against a live database, so I am writing it down before I run it rather than after:
# 1. mount logs.xml into the clickhouse service in compose.yml
    volumes:
      - ./clickhouse/logs.xml:/etc/clickhouse-server/config.d/logs.xml:ro

# 2. recreate the container so the new config is read
docker compose up -d --force-recreate plausible_events_db
Step 3 is the destructive one: TRUNCATE TABLE system.asynchronous_metric_log and its siblings, against a live database. Copy the four files from the community-edition repository before step 1.
Writing the destructive step down before running it is the same reason I put guardrails in front of the agent when running Claude Code against production WordPress. A command you have read is a different risk from a command you have not.
What I have not run yet
The 8.6 GB at the top of this post is the before state, measured today.
I have not run step 3 on this instance, so I am not going to tell you what the after looks like.
Step 1 and 2 are safe and reversible; step 3 destroys server history you might want if you are actively debugging a query.
A related habit that applies to any container you run for years: check what your stack is writing, not only what it is serving.
I make the same argument about log files in the post about a scanner that reported a site clean while it served spam to Googlebot. The dashboard is not the system.
Resources
- plausible/community-edition, the official compose repository. Clone the tag, not the branch.
- The Community Edition wiki, which carries the reverse-proxy and configuration pages the README links to.
- clickhouse/logs.xml at v3.2.1, the 828 bytes this whole post is about.
- ClickHouse operations tips, which the project cites for its low-resource settings.
- DigitalOcean Droplets pricing, server-rendered, so you can read it without a browser.
- Plausible Cloud pricing, for the comparison you should actually run.
One thing to do now
Open a shell on your own ClickHouse container and run the system.parts query from the top of this post. It takes ten seconds and needs no downtime.
If system.asynchronous_metric_log outranks your plausible tables, you are carrying the same several gigabytes I am, and you now know which 828-byte file you forgot to mount.