Running a Self-Hosted Crawler: Crawl4AI and SearXNG in Docker
On this page, 9 sections
Here is the health check on the crawler I use for every piece of research on this site, run this afternoon: crawl health answers with {"status":"ok","version":"0.9.2"} from Crawl4AI and a 200 from SearXNG, alongside the memory line that matters: 1.172GiB.
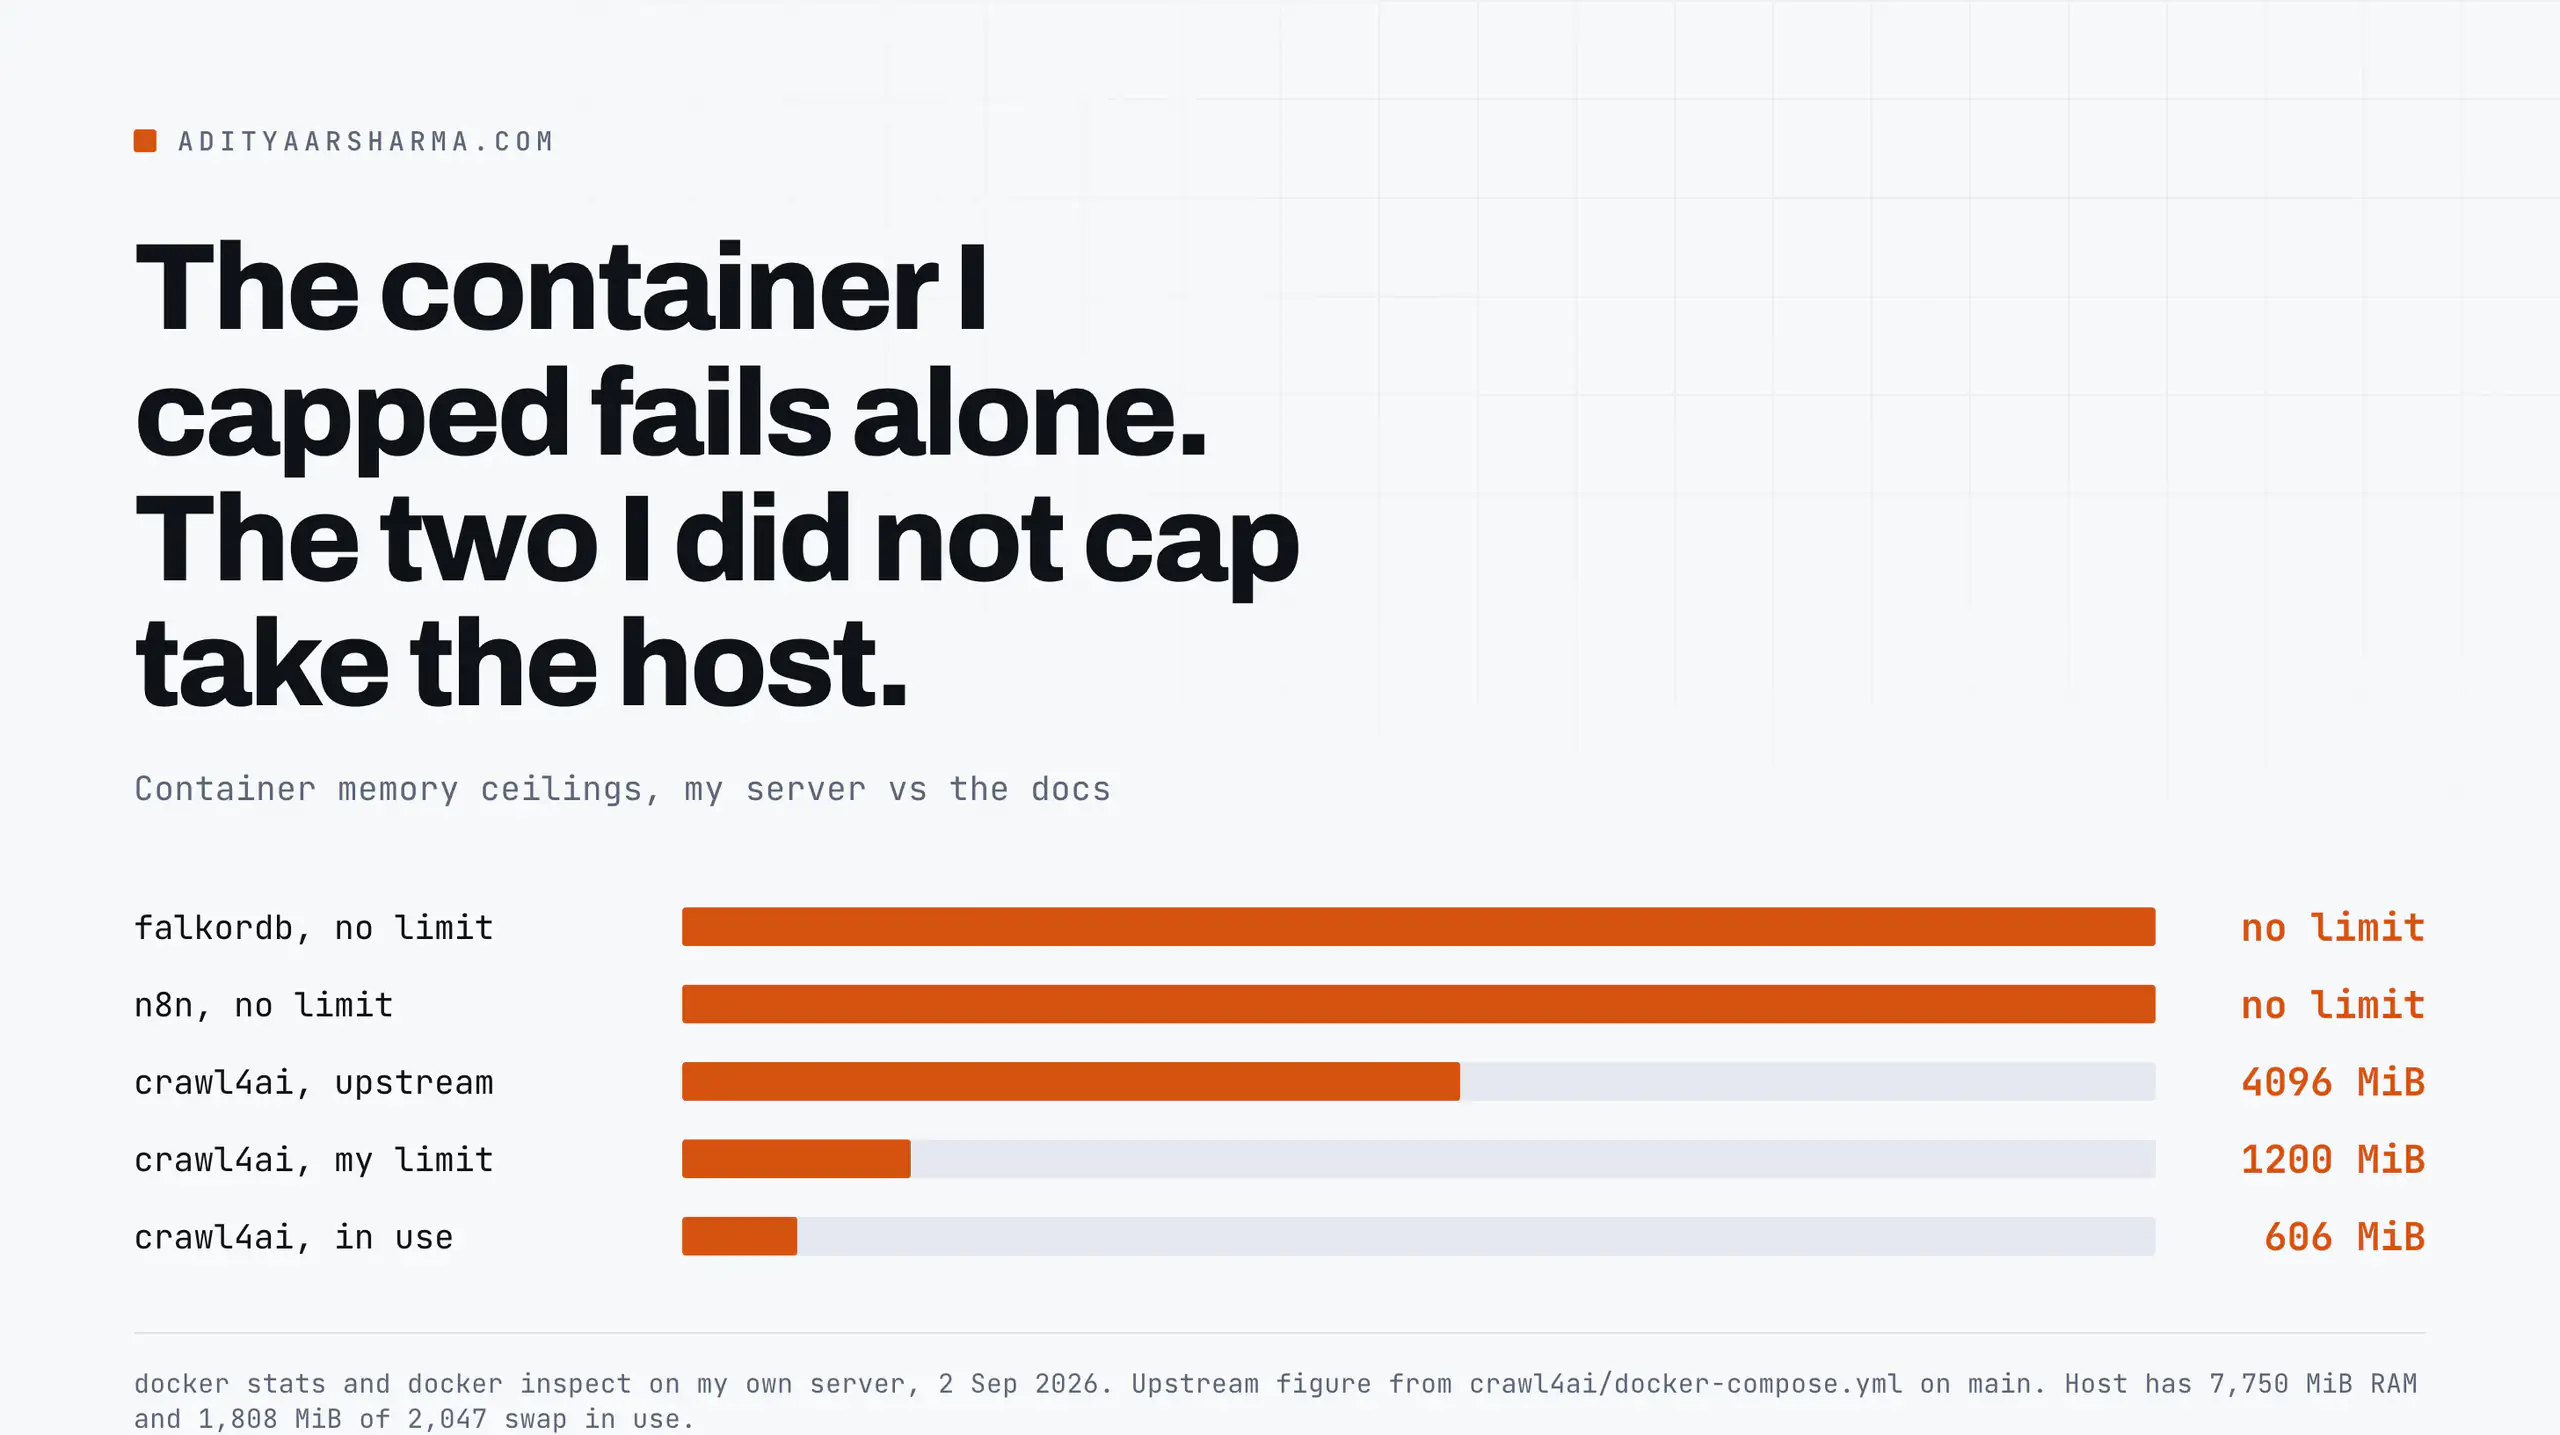
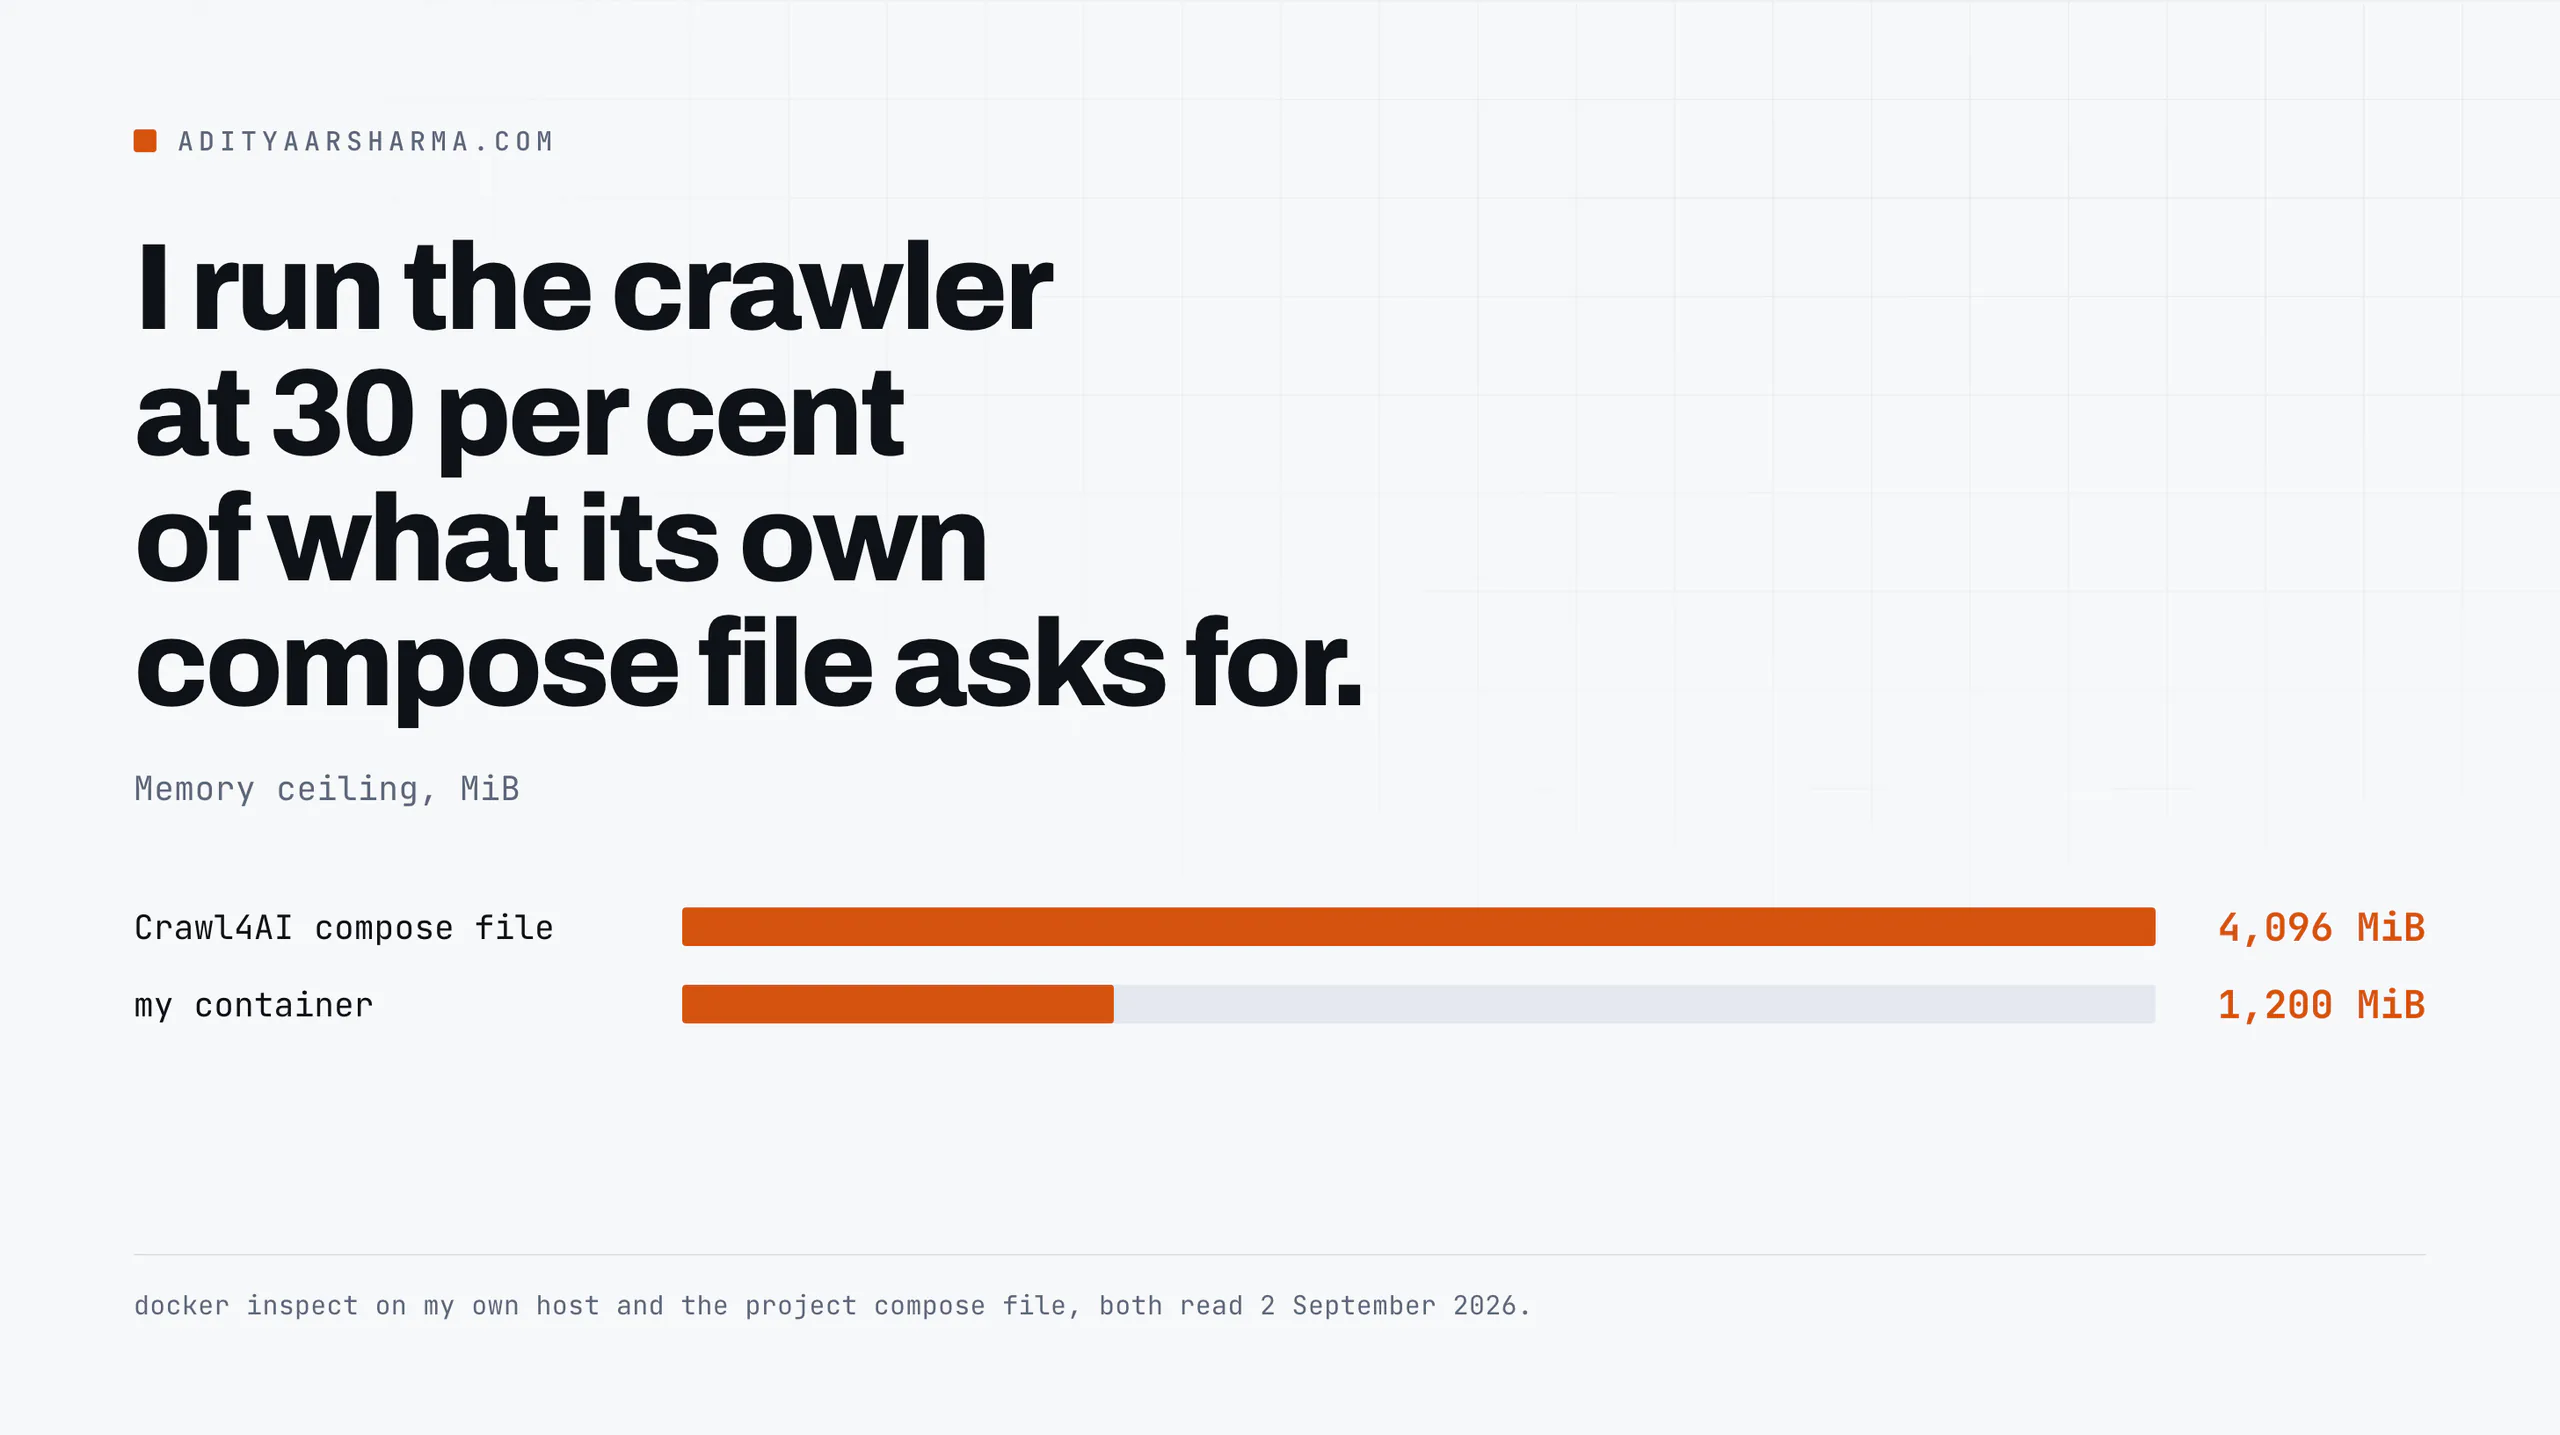
docker stats and docker inspect on my own server, 2 September 2026.That 1.172GiB is not a Docker default and it is not what the project recommends. It is a ceiling I set, and it is 1,258,291,200 bytes, which is 1,200 MiB.
Crawl4AI’s own compose file asks for 4G with a 1G reservation.
I am running the thing at 30 percent of what its authors specify, on a box that also serves my self-hosted analytics, an n8n instance and a graph database.
This post is the honest version of that setup: the real images, the real commands, the two failure modes that actually bit me, and the one I was wrong about.
Crawl4AI: the image, the tag, the command
The image, and what it weighs
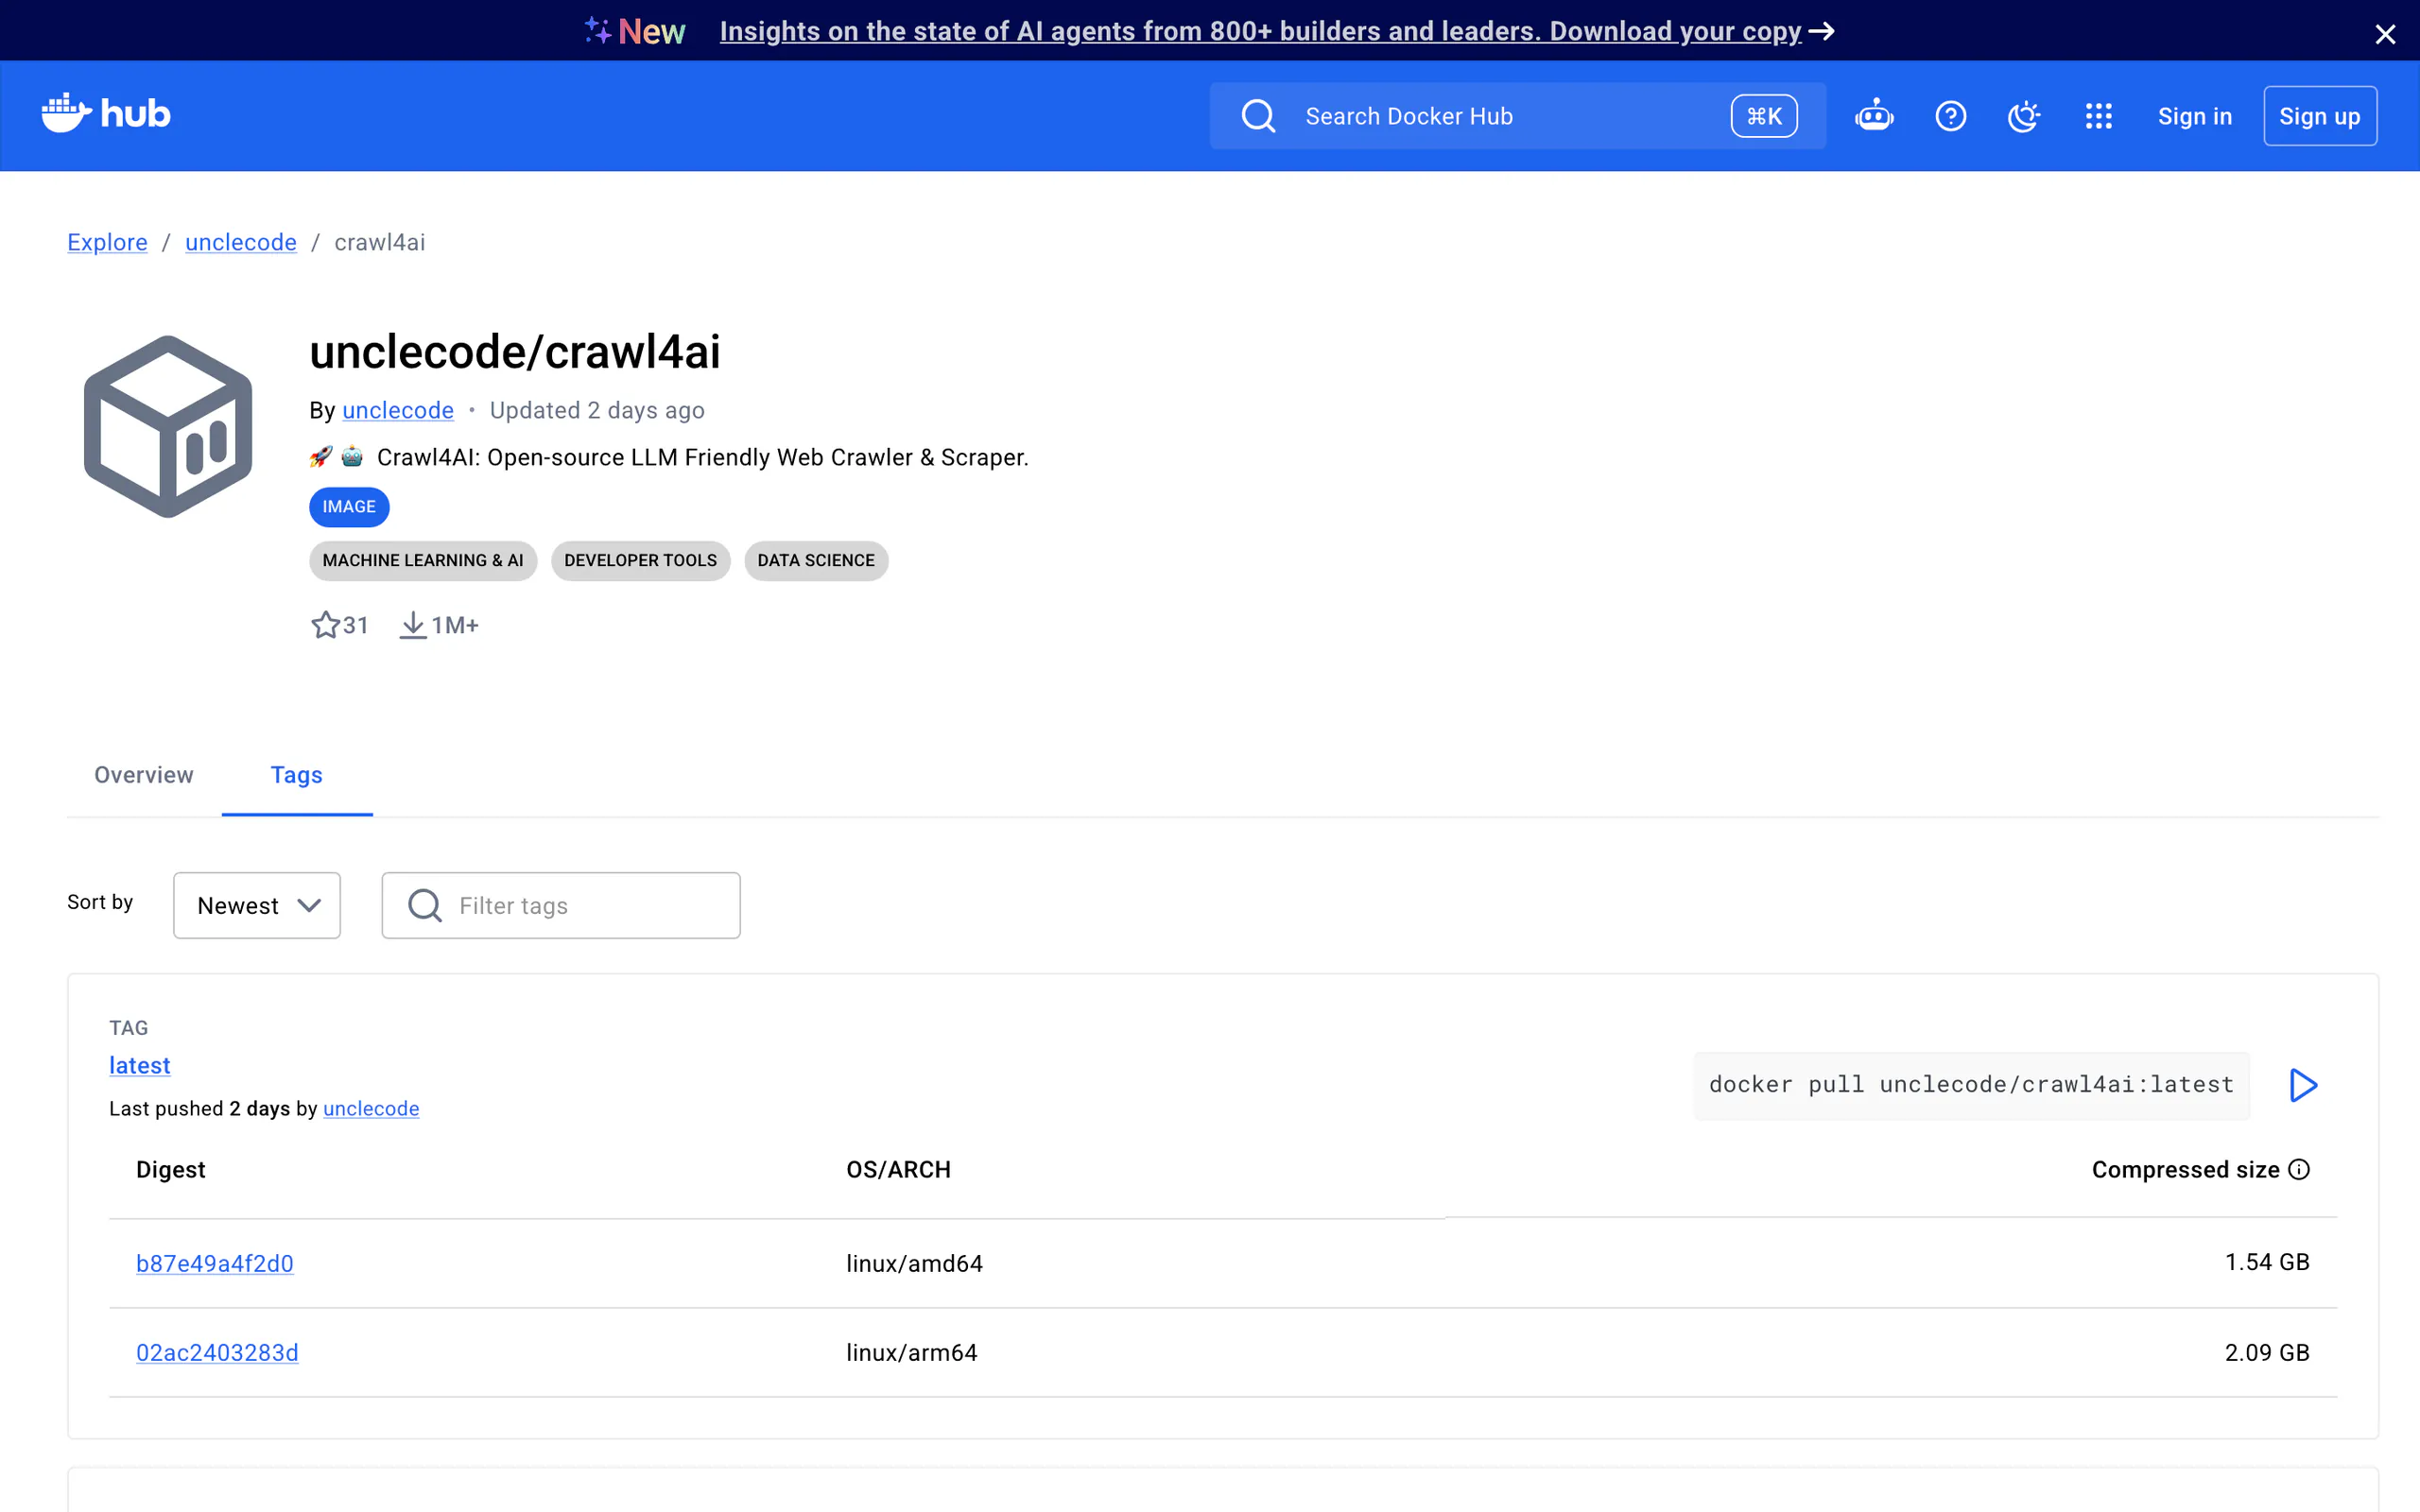
The image is unclecode/crawl4ai. Docker Hub shows 1M+ pulls and, for the latest tag, a compressed size of 1.54 GB on linux/amd64 and 2.09 GB on linux/arm64 (read 2 September 2026).
Uncompressed on my server it is larger: docker image inspect unclecode/crawl4ai:latest --format '{{.Size}}' returns 4232061763 bytes. docker system df put total images on that host at 9.97 GB.
Just under 4 GB for one image, and 9.97 GB of images on a 150 GB disk.
That is the first cost nobody mentions: Crawl4AI ships a full Playwright Chromium inside the container, which is the whole point of it and also the whole weight of it.
The run command from the project README, unedited:
docker pull unclecode/crawl4ai:latest
docker run -d -p 11235:11235 --name crawl4ai --shm-size=1g unclecode/crawl4ai:latest

# dashboard:  http://localhost:11235/dashboard
# playground: http://localhost:11235/playground
# health:     http://localhost:11235/health
The two load-bearing flags
Two things in that line are load-bearing. --shm-size=1g is there because Chromium puts renderer shared memory in /dev/shm, and Docker’s default is 64 MiB, which is nowhere near enough for a browser.
And there is no memory limit on it at all, which is fine on a laptop and is a decision you have to make yourself on a shared server.
The compose file is the safer copy
The project’s docker-compose.yml is the more careful version of the same thing, and it is worth copying rather than the one-liner: It sets shm_size: "1gb", cap_drop: ALL, security_opt: no-new-privileges:true, read_only: true, a PID cap and a named user.
A read-only root filesystem, all capabilities dropped, a PID cap and a named user. You are running a headless browser that fetches arbitrary internet content and parses it. Treat it like that.
Where my box differs from the docs, and what it costs
Mine does not match. Here is the gap, straight from docker inspect: docker inspect crawl4ai with a --format string for HostConfig.Memory, HostConfig.ShmSize and HostConfig.CpuQuota prints the gap in one line.
- memory: 1,200 MiB against a documented 4,096 MiB limit and 1,024 MiB reservation
- shm: 512 MiB against a documented 1,024 MiB
- cpus: 1.5 of the host’s cores
Why the shm number matters more than it looks
The mechanism that makes the shm number more interesting than it looks: on cgroup v2, which is what this host uses (stat -fc %T /sys/fs/cgroup/ returns cgroup2fs), tmpfs pages are charged to the cgroup that faults them in.
So /dev/shm is not a separate allowance sitting outside the memory limit. Every megabyte Chromium writes there comes out of the same 1,200 MiB.
Fill the 512 MiB shm and you have 688 MiB left for Python, the Playwright supervisor and every browser process.
That is why the client-side pacing in my wrapper is not politeness theatre. Two concurrent fetches, a randomised 1.5 to 3.0 second gap per domain, and a hard ceiling of 300 requests per domain per day.
Raise the concurrency on this container and the failure is not slow, it is a kill.
The thing I got wrong about the blast radius
I assumed for months that an out-of-memory event in the crawler would take the box with it. It will not, and the reason matters if you are sizing a shared server.
A cgroup limit is a wall in one direction
A cgroup memory limit is a wall in one direction. When processes inside the container exceed it, the kernel reclaims and then kills inside that cgroup. The container dies. The host does not. So the container I capped is the one that fails safely.
The containers I did not cap
The dangerous ones on that host are the containers I did not cap: docker stats --no-stream told the story. SearXNG sat at 82.36MiB against a 4GiB limit. The containers I never capped reported their usage against 7.569GiB.
7.569GiB is not a limit. That is Docker reporting total host memory because no limit was set.
FalkorDB and n8n can each grow until the host OOM killer starts choosing victims by score, and it will not necessarily choose them.
FalkorDB is on that box because it is one of the graph backends Graphiti supports, which is why it turned up when I benchmarked seven AI memory tools. It is a database, and databases are the ones you cap first.
Add the swap figure from that host, 1,808 MiB used of 2,047, and you have a machine with nowhere left to spill.
So the correction to the thing I believed: cap everything, and cap the databases first. The crawler with a limit is the well-behaved one.
SearXNG: the repository most guides still link is archived
The 3.3k star repository is archived
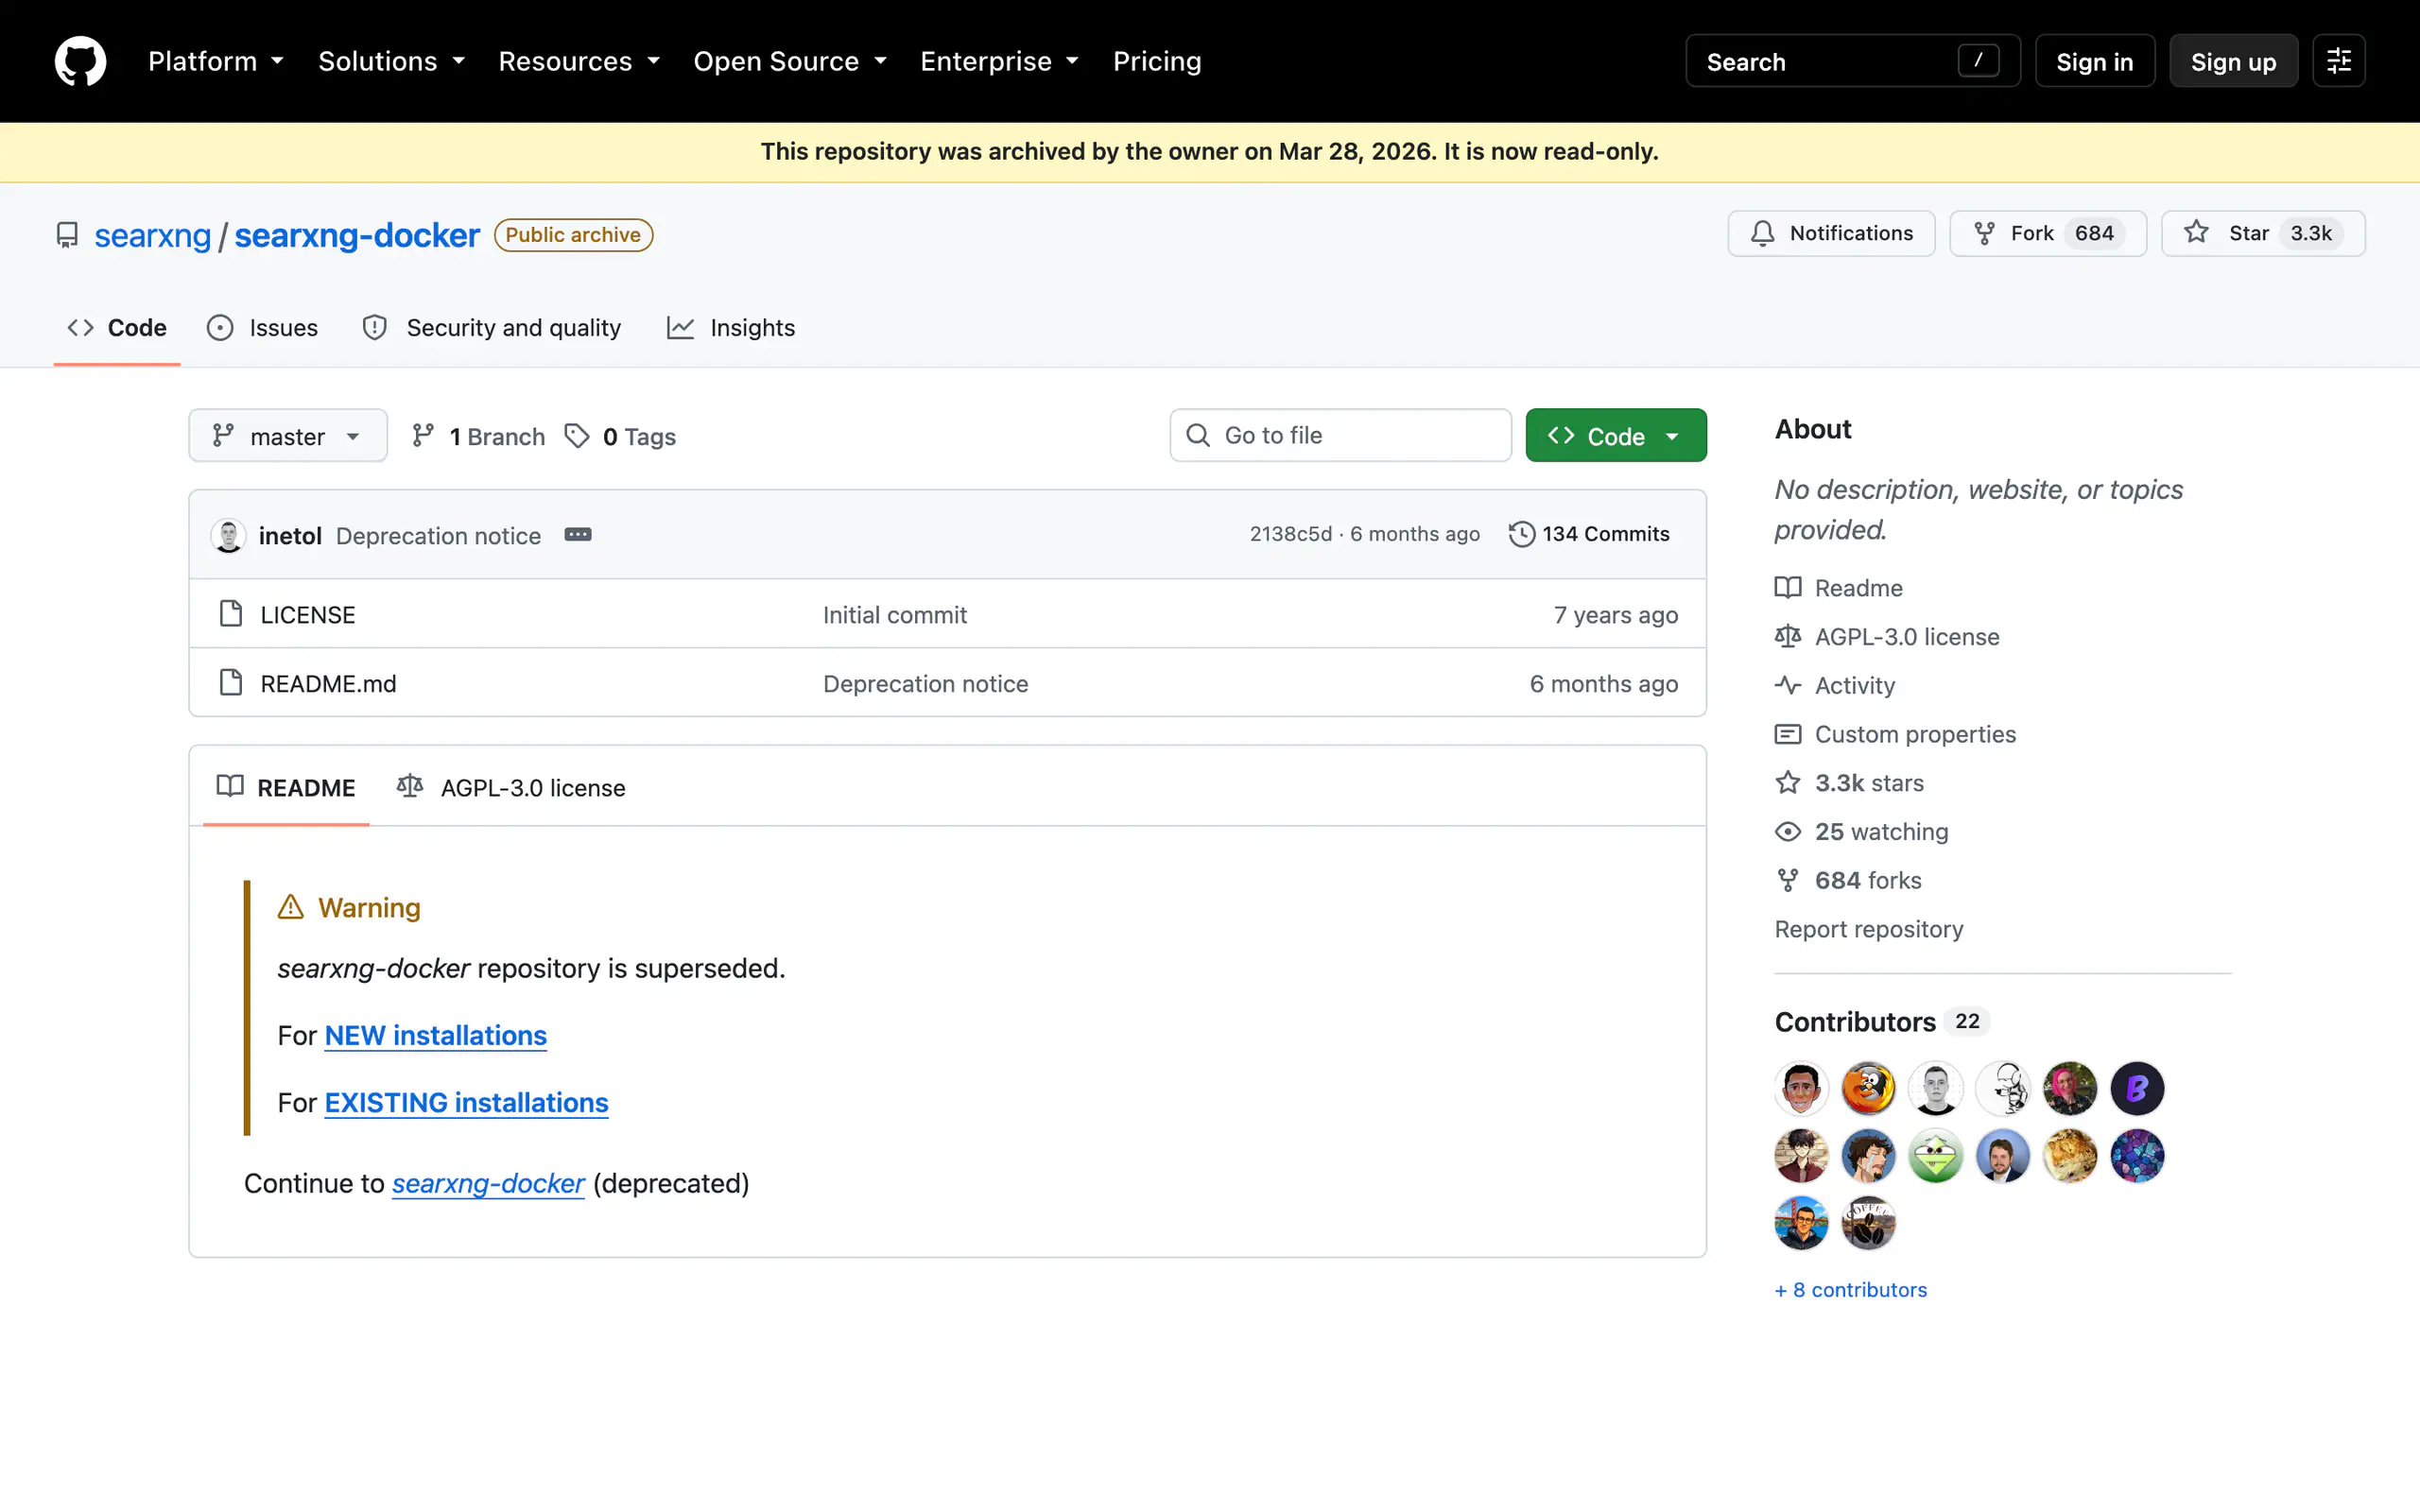
If you search for how to run SearXNG in Docker you land on searxng/searxng-docker, 3.3k stars, and clone it.
It was archived on 28 March 2026 and its README now contains two lines and a deprecation warning. The repository has exactly two files left in it: LICENSE and README.md.
The current instructions live in the project’s own documentation, and the compose template moved into the main repository under container/. Create ./searxng/core-config/, then pull two files with curl -fsSL -O from the main searxng/searxng repository: container/docker-compose.yml and container/.env.example.
Copy the example before you start anything. The compose file declares env_file: ./.env, so Compose does not fall back to defaults when that file is absent. It fails. Run cp -i .env.example .env first.
Every value in it ships commented out, which is fine. The image tag falls back with ${SEARXNG_VERSION:-latest} and the port with ${SEARXNG_PORT:-8080}. Uncomment SEARXNG_HOST only when you want it bound somewhere other than every interface. Read from the searxng/searxng master branch, 3 September 2026.
The template it fetches is short and names two images: docker.io/searxng/searxng:latest for the core service, and docker.io/valkey/valkey:9-alpine for the cache.
Valkey, not Redis
Note valkey/valkey:9-alpine rather than Redis. If you are following a 2024 guide that starts a redis:alpine sidecar, that is the tell that the guide is stale.
For a single container, the docs give docker run --name searxng -d -p 8888:8080 with the config and data directories bind-mounted from ./searxng/config/ and ./searxng/data/, and that is what I actually run.
Mine binds to loopback only, which docker port confirms: 8080/tcp -> 127.0.0.1:8888. If you are going to disable the request limiter, as I have, that binding is the thing standing between you and a public open proxy.
The JSON API is off by default, and the failure is a 403
Every wrapper you write against SearXNG will want format=json. It is disabled out of the box.
I ran a clean container to see exactly what happens rather than describe it. The container was docker run -d --rm --name searxng-default -p 8877:8080 searxng/searxng:latest, then asked it the same query twice with curl -s -o /dev/null -w '%{http_code}'.
Plain HTML came back 200. Adding &format=json came back 403.
What the 403 actually means
A 403 with an HTML body, from a server that answered the identical query with a 200 one second earlier.
If you are debugging through a client library that only surfaces status codes, that reads like an auth problem, and it is a config problem. The cause is three lines in the shipped settings.yml:
84:  # formats: [html, csv, json, rss]
85:  formats:
86-    - html
Add - json under formats: in your own /etc/searxng/settings.yml and restart. That is the whole fix.
The failure that produces false research findings
This is the one worth the price of the post, because it does not look like a failure. SearXNG suspends an engine after errors, and the durations are in the documented defaults:
search:
  ban_time_on_fail: 5
  max_ban_time_on_fail: 120
  suspended_times:
    SearxEngineAccessDenied: 86400
    SearxEngineCaptcha: 86400
    SearxEngineTooManyRequests: 3600
    cf_SearxEngineCaptcha: 1296000
    cf_SearxEngineAccessDenied: 86400
    recaptcha_SearxEngineCaptcha: 604800
An engine that answers with 429 is out for 3,600 seconds. One that returns a Cloudflare captcha is out for 1,296,000 seconds, which is fifteen days.
Google and Bing and Brave all fingerprint datacenter IP ranges, so a SearXNG instance on a VPS collects these suspensions steadily.
Why a dead index looks like a real negative
Here is the failure mode. When every enabled engine is suspended, SearXNG does not error. It returns HTTP 200 with an empty results array.
Your script sees a healthy response and zero results, and if you are using that script for research you will write down that a thing does not exist when the truth is that your search engine was asleep.
My own settings.yml carries the scar and the date:
- Mojeek, Marginalia, Yep and Right Dao, kept because they run their own indexes and do not need a residential IP
- the comment above the list in my own file records why: independent crawlers do not run aggressive anti-bot, so a datacenter IP is fine
Mojeek, Marginalia, Yep and Right Dao run their own indexes rather than proxying a major engine, so they have no commercial reason to block a datacenter IP. Coverage is narrower than Google.
Availability is far better, and for research a narrow index that answers beats a wide one that is suspended.
The control query rule
The operational rule that falls out of this: run a control query with a known-good answer before you record any negative finding. If the control returns nothing, your crawler is broken, not the web.
I use this on every research run, and it has caught the empty-200 twice.
That is the same shape as the malware case I wrote up when the scanner reported the site clean while it served spam to Googlebot. A tool answering confidently is not the same as a tool being right.
The same discipline applies whenever you scrape structurally rather than by hand. I wrote up the sitemap version of it in extracting links from a website using its sitemap, and the crawl-control side of it in stopping WooCommerce add-to-cart URLs from being crawled.
What this replaces, in money
Two containers on a server I already pay for, against the hosted equivalents, all read 2 September 2026:
- Firecrawl lists a Free tier at 1,000 credits a month, Standard at $83/month for 100,000 credits, and Scale at $599/month for 1,000,000. Credits do not roll over on self-serve plans.
- Brave’s Search API page lists $5 per 1,000 requests, with $5 of free credits every month.
- Crawl4AI is Apache-2.0 (81,087 stars). SearXNG is AGPL-3.0 (36,426 stars). Both figures from the GitHub API, 2 September 2026.
The self-hosted side is not free. It is roughly 4 GB of image, 1.2 GB of RAM under a cap, whatever your VPS costs, and the two failure modes above.
What it is not is metered, and for research work that runs hundreds of fetches in an afternoon, the meter is the thing that changes your behaviour.
The full arithmetic, with backups and monitoring priced in, is in what self-hosting actually costs.
Resources
- unclecode/crawl4ai, Apache-2.0. The README carries the run command and the dashboard endpoints.
- The Crawl4AI compose file, which is the hardened version of that command.
- SearXNG container installation docs, the page that replaced the archived repository.
- SearXNG search settings reference, where the
formatsandsuspended_timesdefaults are documented. - The current SearXNG compose template, core plus valkey.
- Firecrawl pricing and the Brave Search API page, for the comparison.
One thing to do now
Run docker stats --no-stream on whatever box you are self-hosting on and read the right-hand side of the memory column. Any container reporting your full host RAM as its limit has no limit.
Give the databases one first, then the crawler. It takes one line per service and it decides which process dies when the box runs out.