What Self-Hosting Actually Costs, Against the SaaS You Are Replacing
On this page, 10 sections
I ran docker system df on my laptop while writing this. It is a work machine, not a server:
$ docker system df
TYPE            TOTAL     ACTIVE    SIZE      RECLAIMABLE
Images            102        49    67.03GB   21.89GB (32%)
Containers         81        29      973MB   622.2MB (63%)
Local Volumes      90        54    17.88GB   4.491GB (25%)
Build Cache       702         0    27.23GB   7.423GB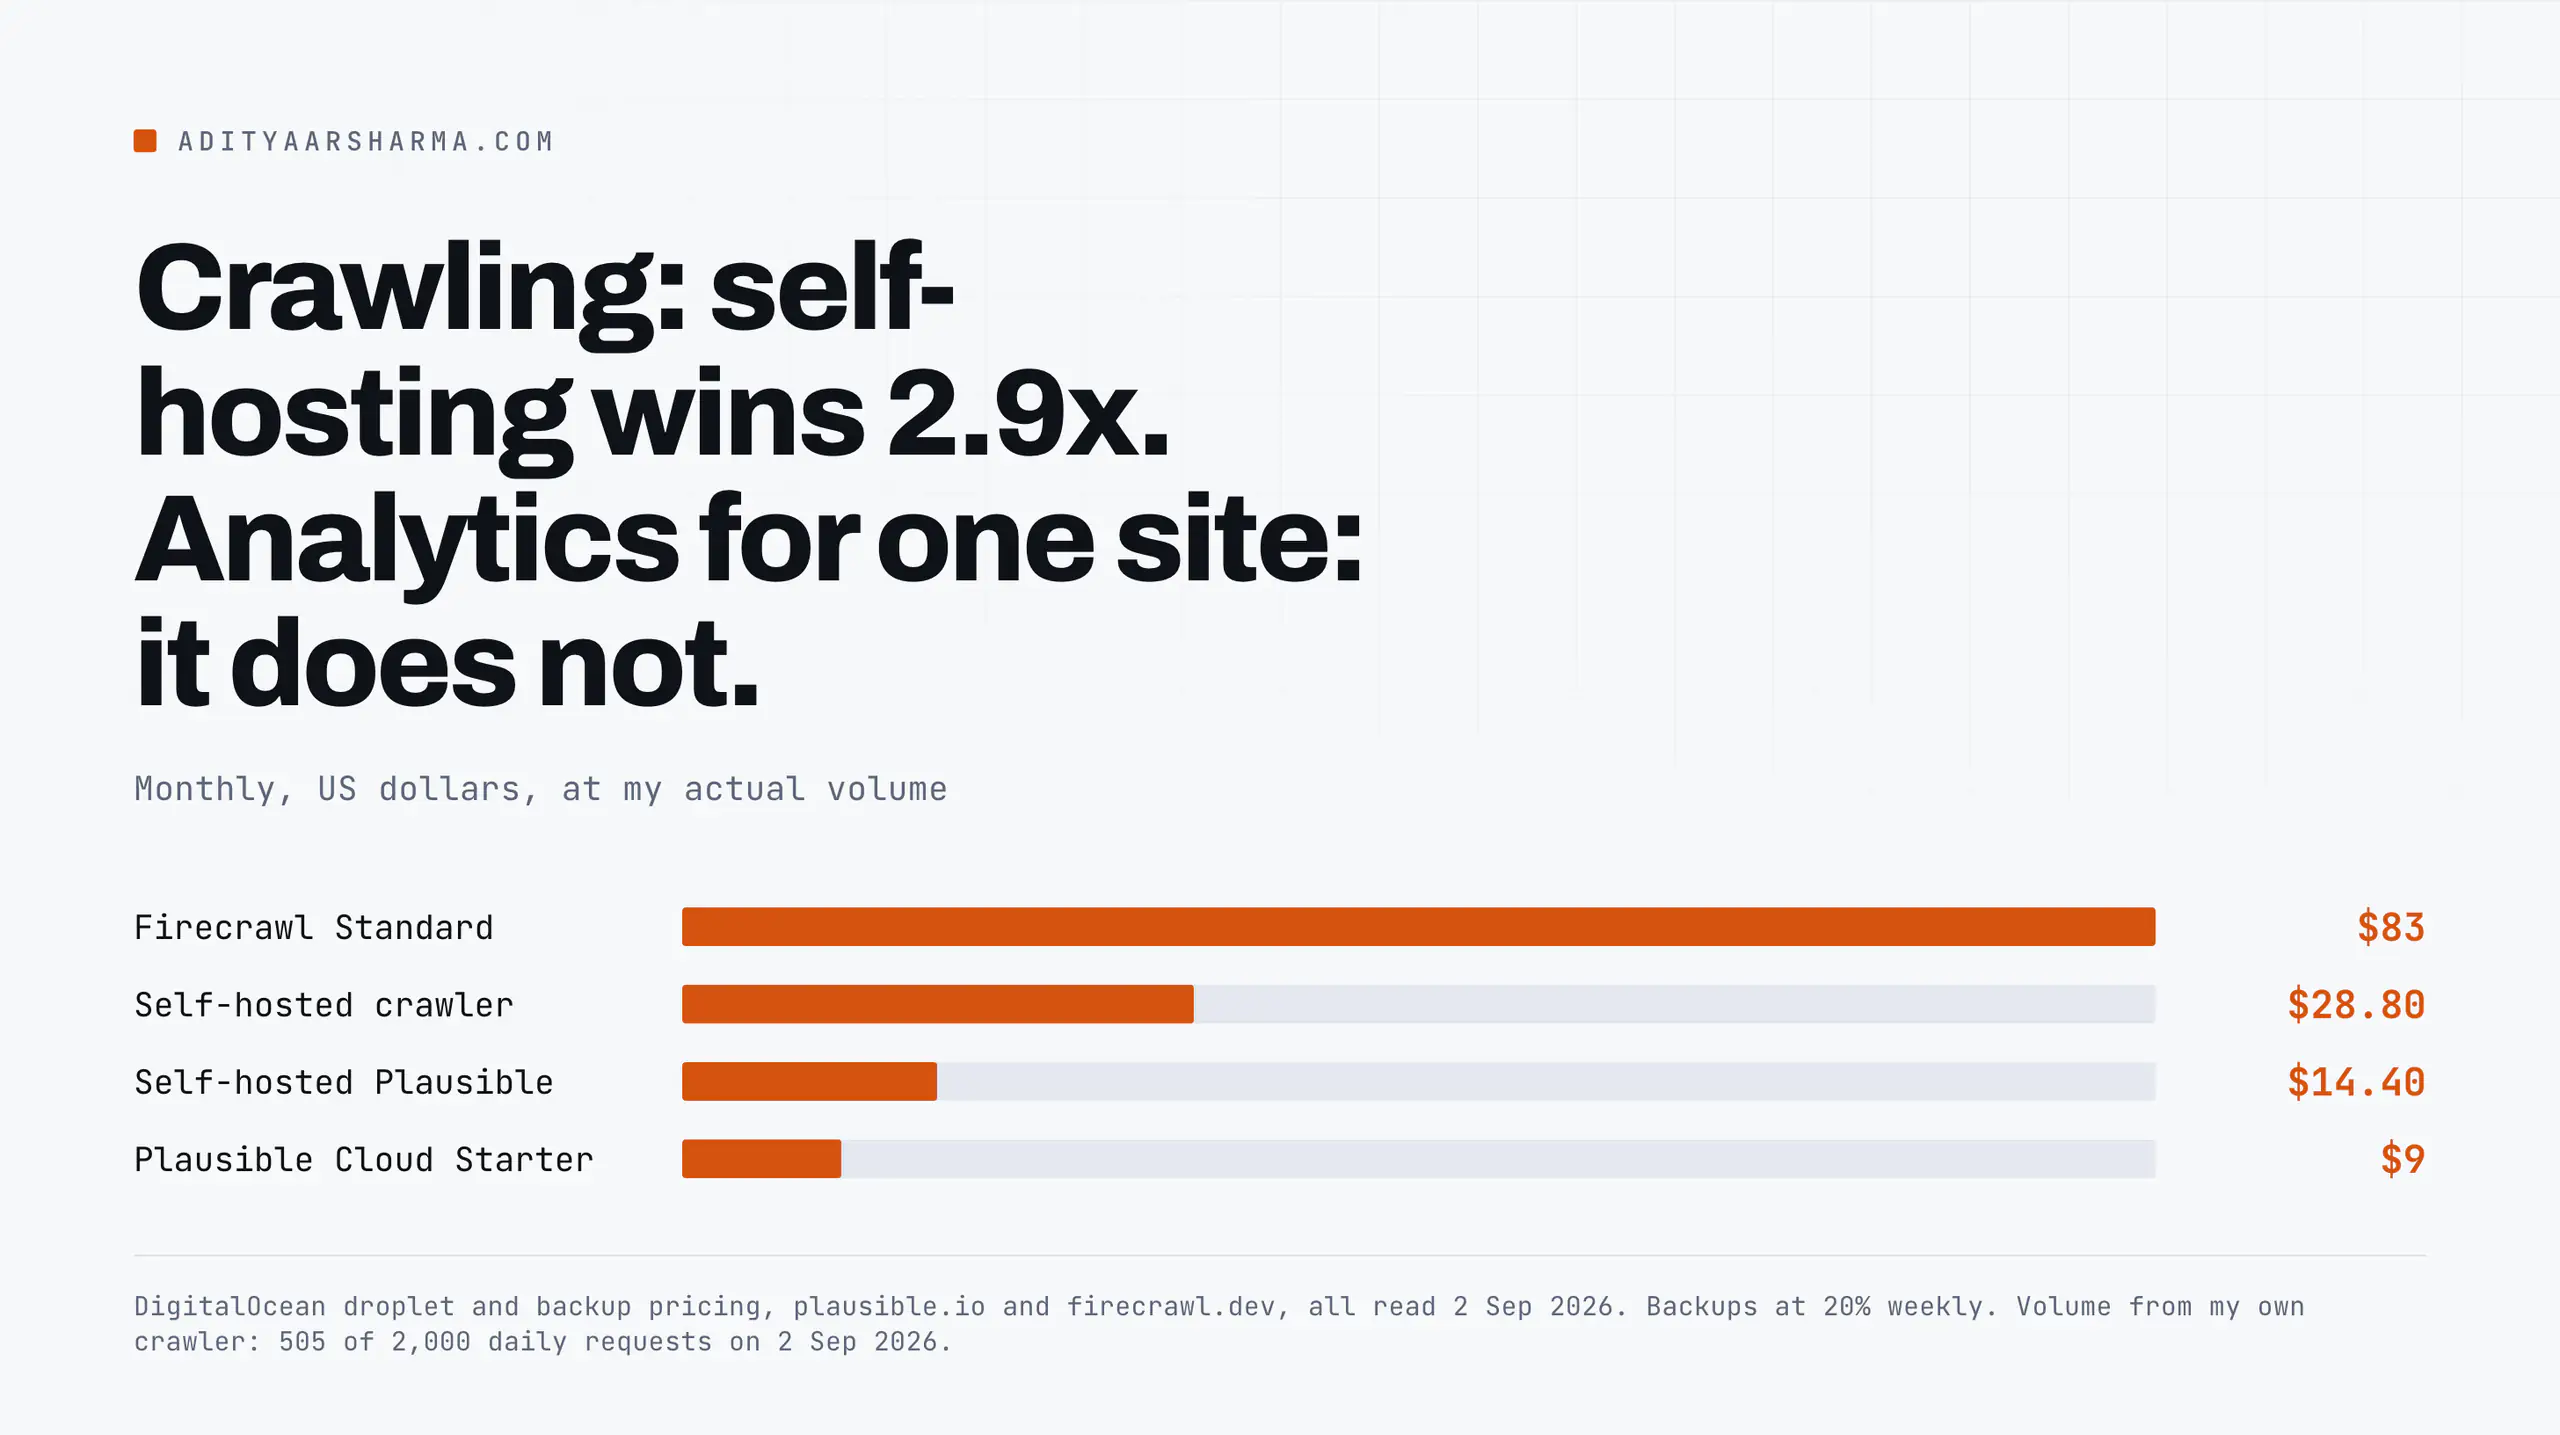
112 GB. None of that appears in any self-hosting cost comparison I have read,
because those comparisons all compute the same two numbers: the VPS price and the SaaS price.
The VPS price is the smallest honest line in the whole calculation.
So here is the version with the rest of the lines filled in, using my own server and my own laptop, checked on 2 September 2026.
The conclusion is split: for the crawling and search workload, self-hosting wins by roughly 3x and keeps winning as volume grows.
For analytics on a single small site, it loses to a $9 subscription and I keep doing it anyway, for a reason I can name.
Line 1: the machine
Hetzner is where my box lives, but their price grid is injected client-side and does not render for a crawler, so I will not quote a figure I could not read.
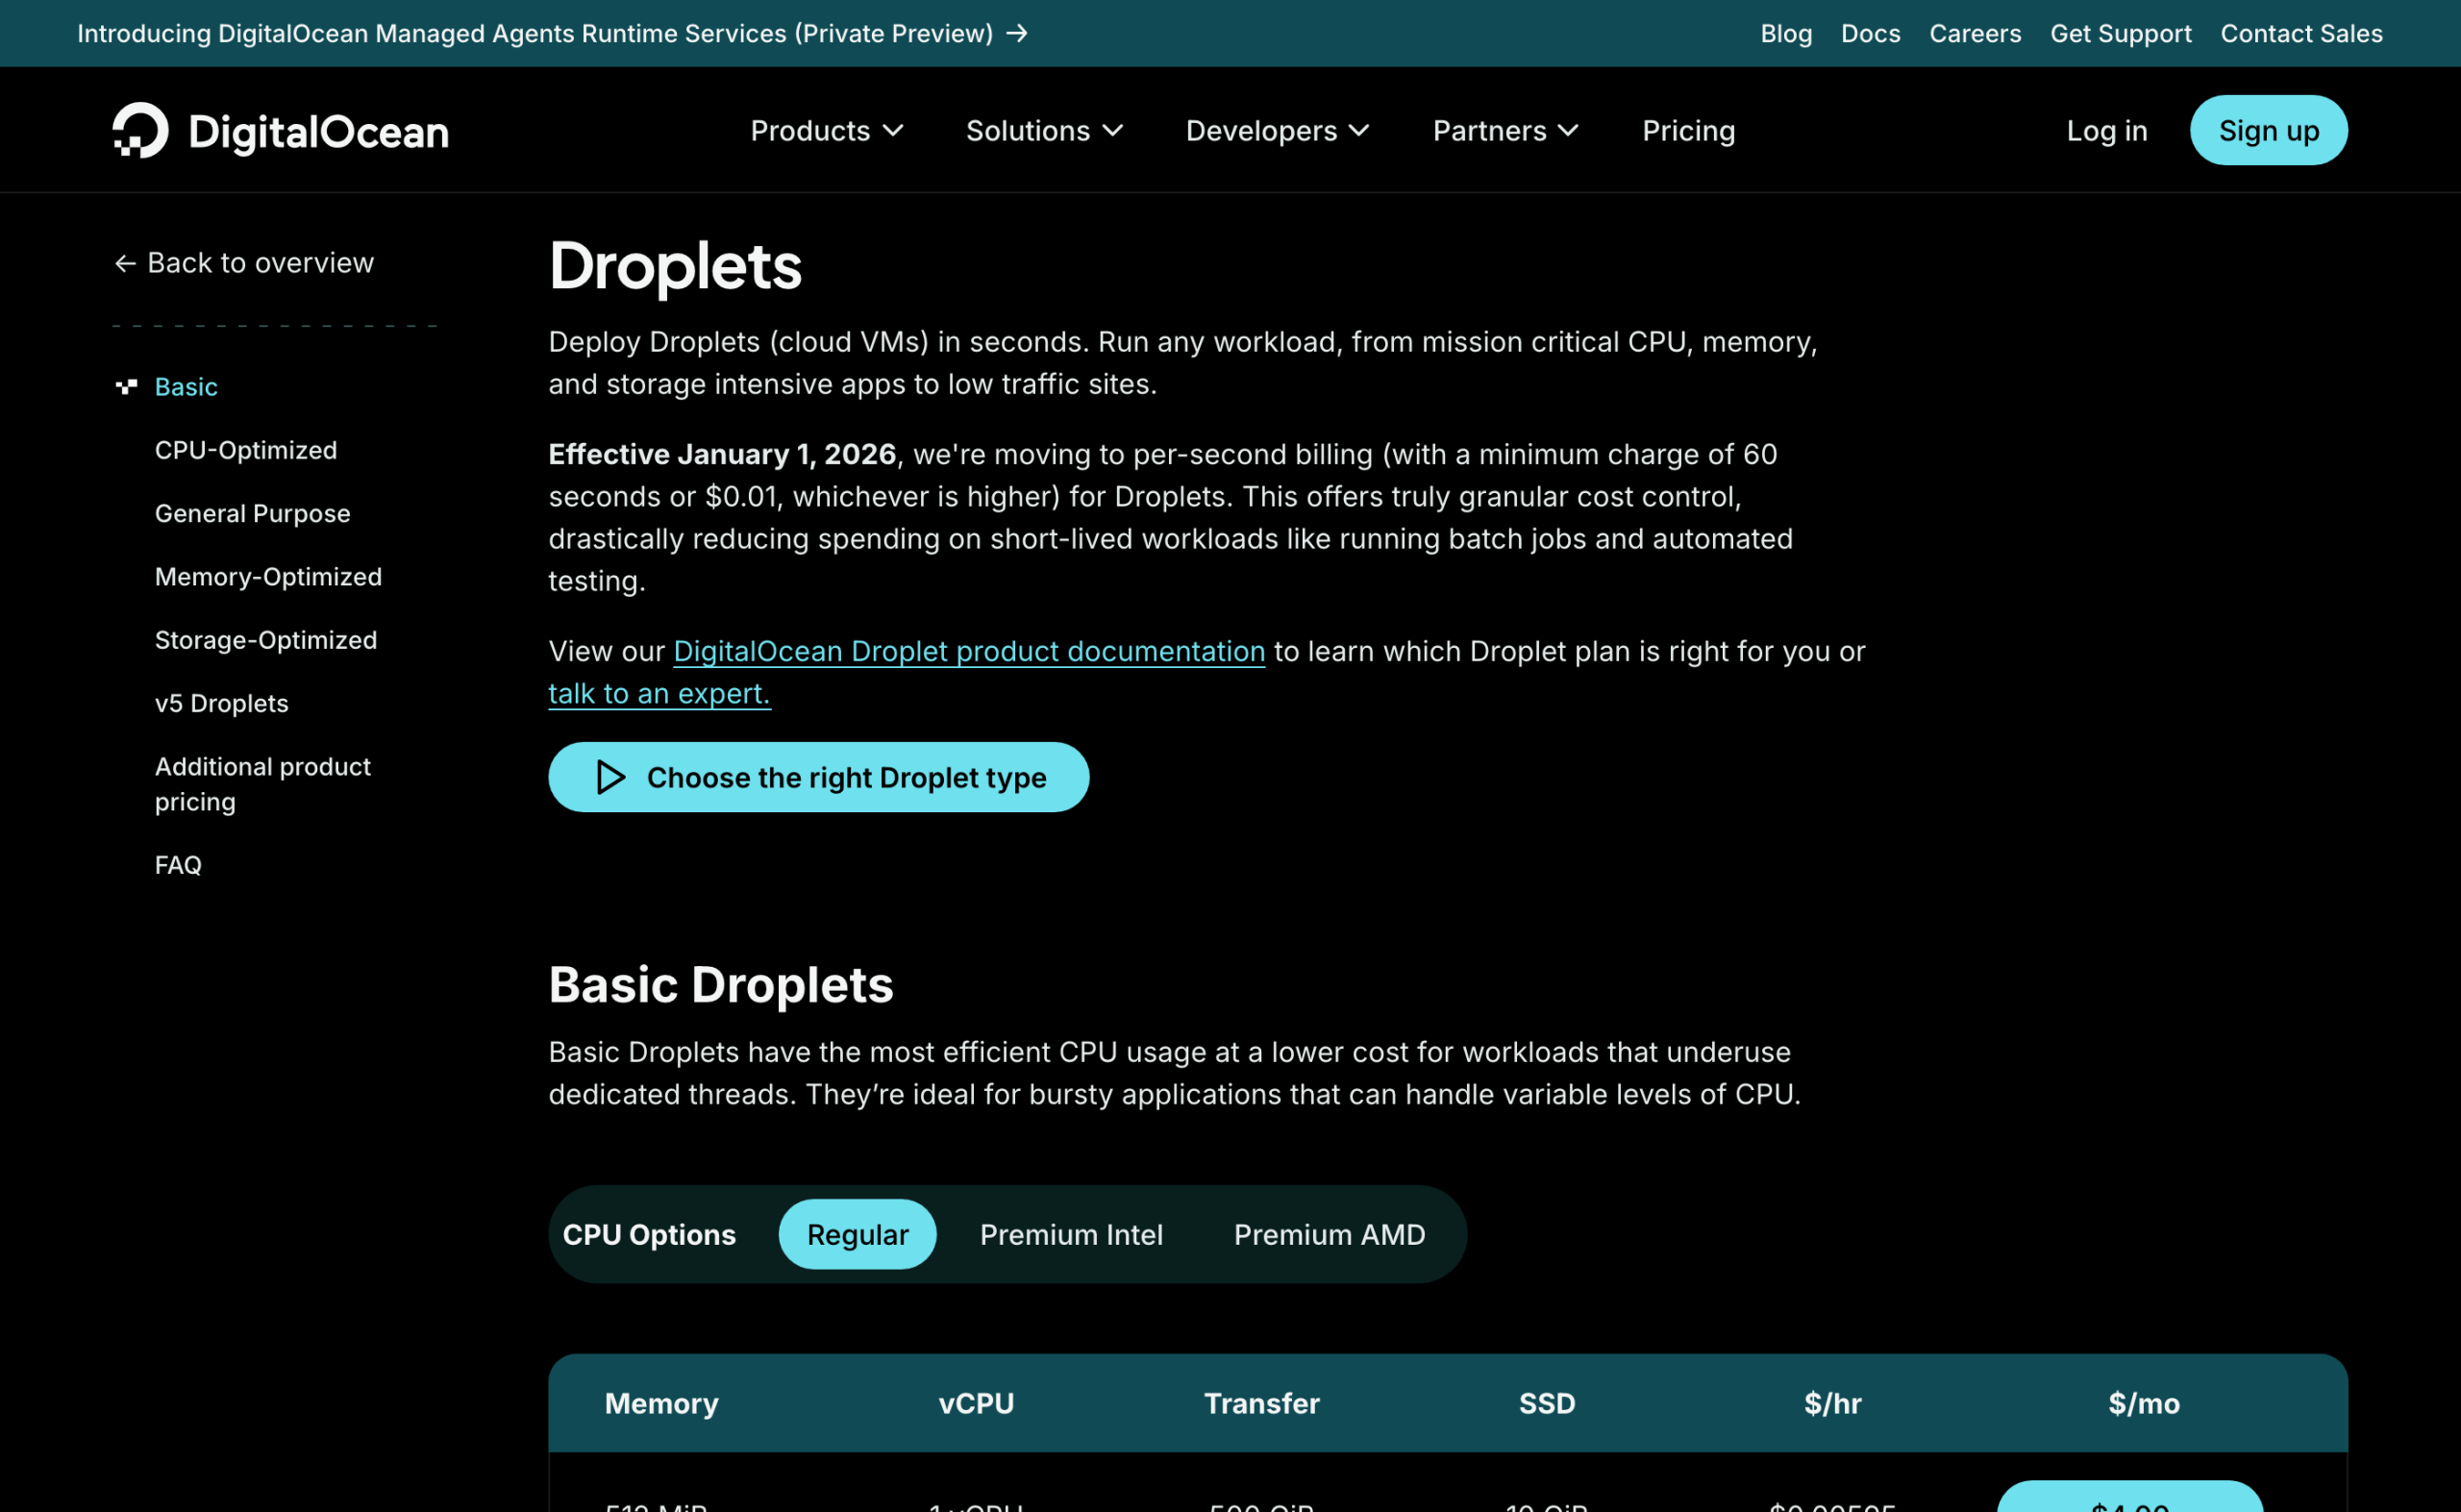
DigitalOcean publishes the same class of machine server-side. Their Basic Droplets, regular CPU, monthly caps, read 2 September 2026:
| Memory | vCPU | Transfer | SSD | $/mo |
|---|---|---|---|---|
| 512 MiB | 1 vCPU | 500 GiB | 10 GiB | $4.00 |
| 1 GiB | 1 vCPU | 1,000 GiB | 25 GiB | $6.00 |
| 2 GiB | 1 vCPU | 2,000 GiB | 50 GiB | $12.00 |
| 2 GiB | 2 vCPUs | 3,000 GiB | 60 GiB | $18.00 |
| 4 GiB | 2 vCPUs | 4,000 GiB | 80 GiB | $24.00 |
| 8 GiB | 4 vCPUs | 5,000 GiB | 160 GiB | $48.00 |
| 16 GiB | 8 vCPUs | 6,000 GiB | 320 GiB | $96.00 |
Which line my own box sits on
My server runs seven containers: Plausible plus ClickHouse plus Postgres, Crawl4AI, SearXNG, FalkorDB and n8n. free -m shows 7,750 MiB of RAM. The equivalent line is the $48 one.
Hold that number, because three later lines are calculated from it rather than from anything about my data.
Line 2: backups, which are priced on the machine and not the data
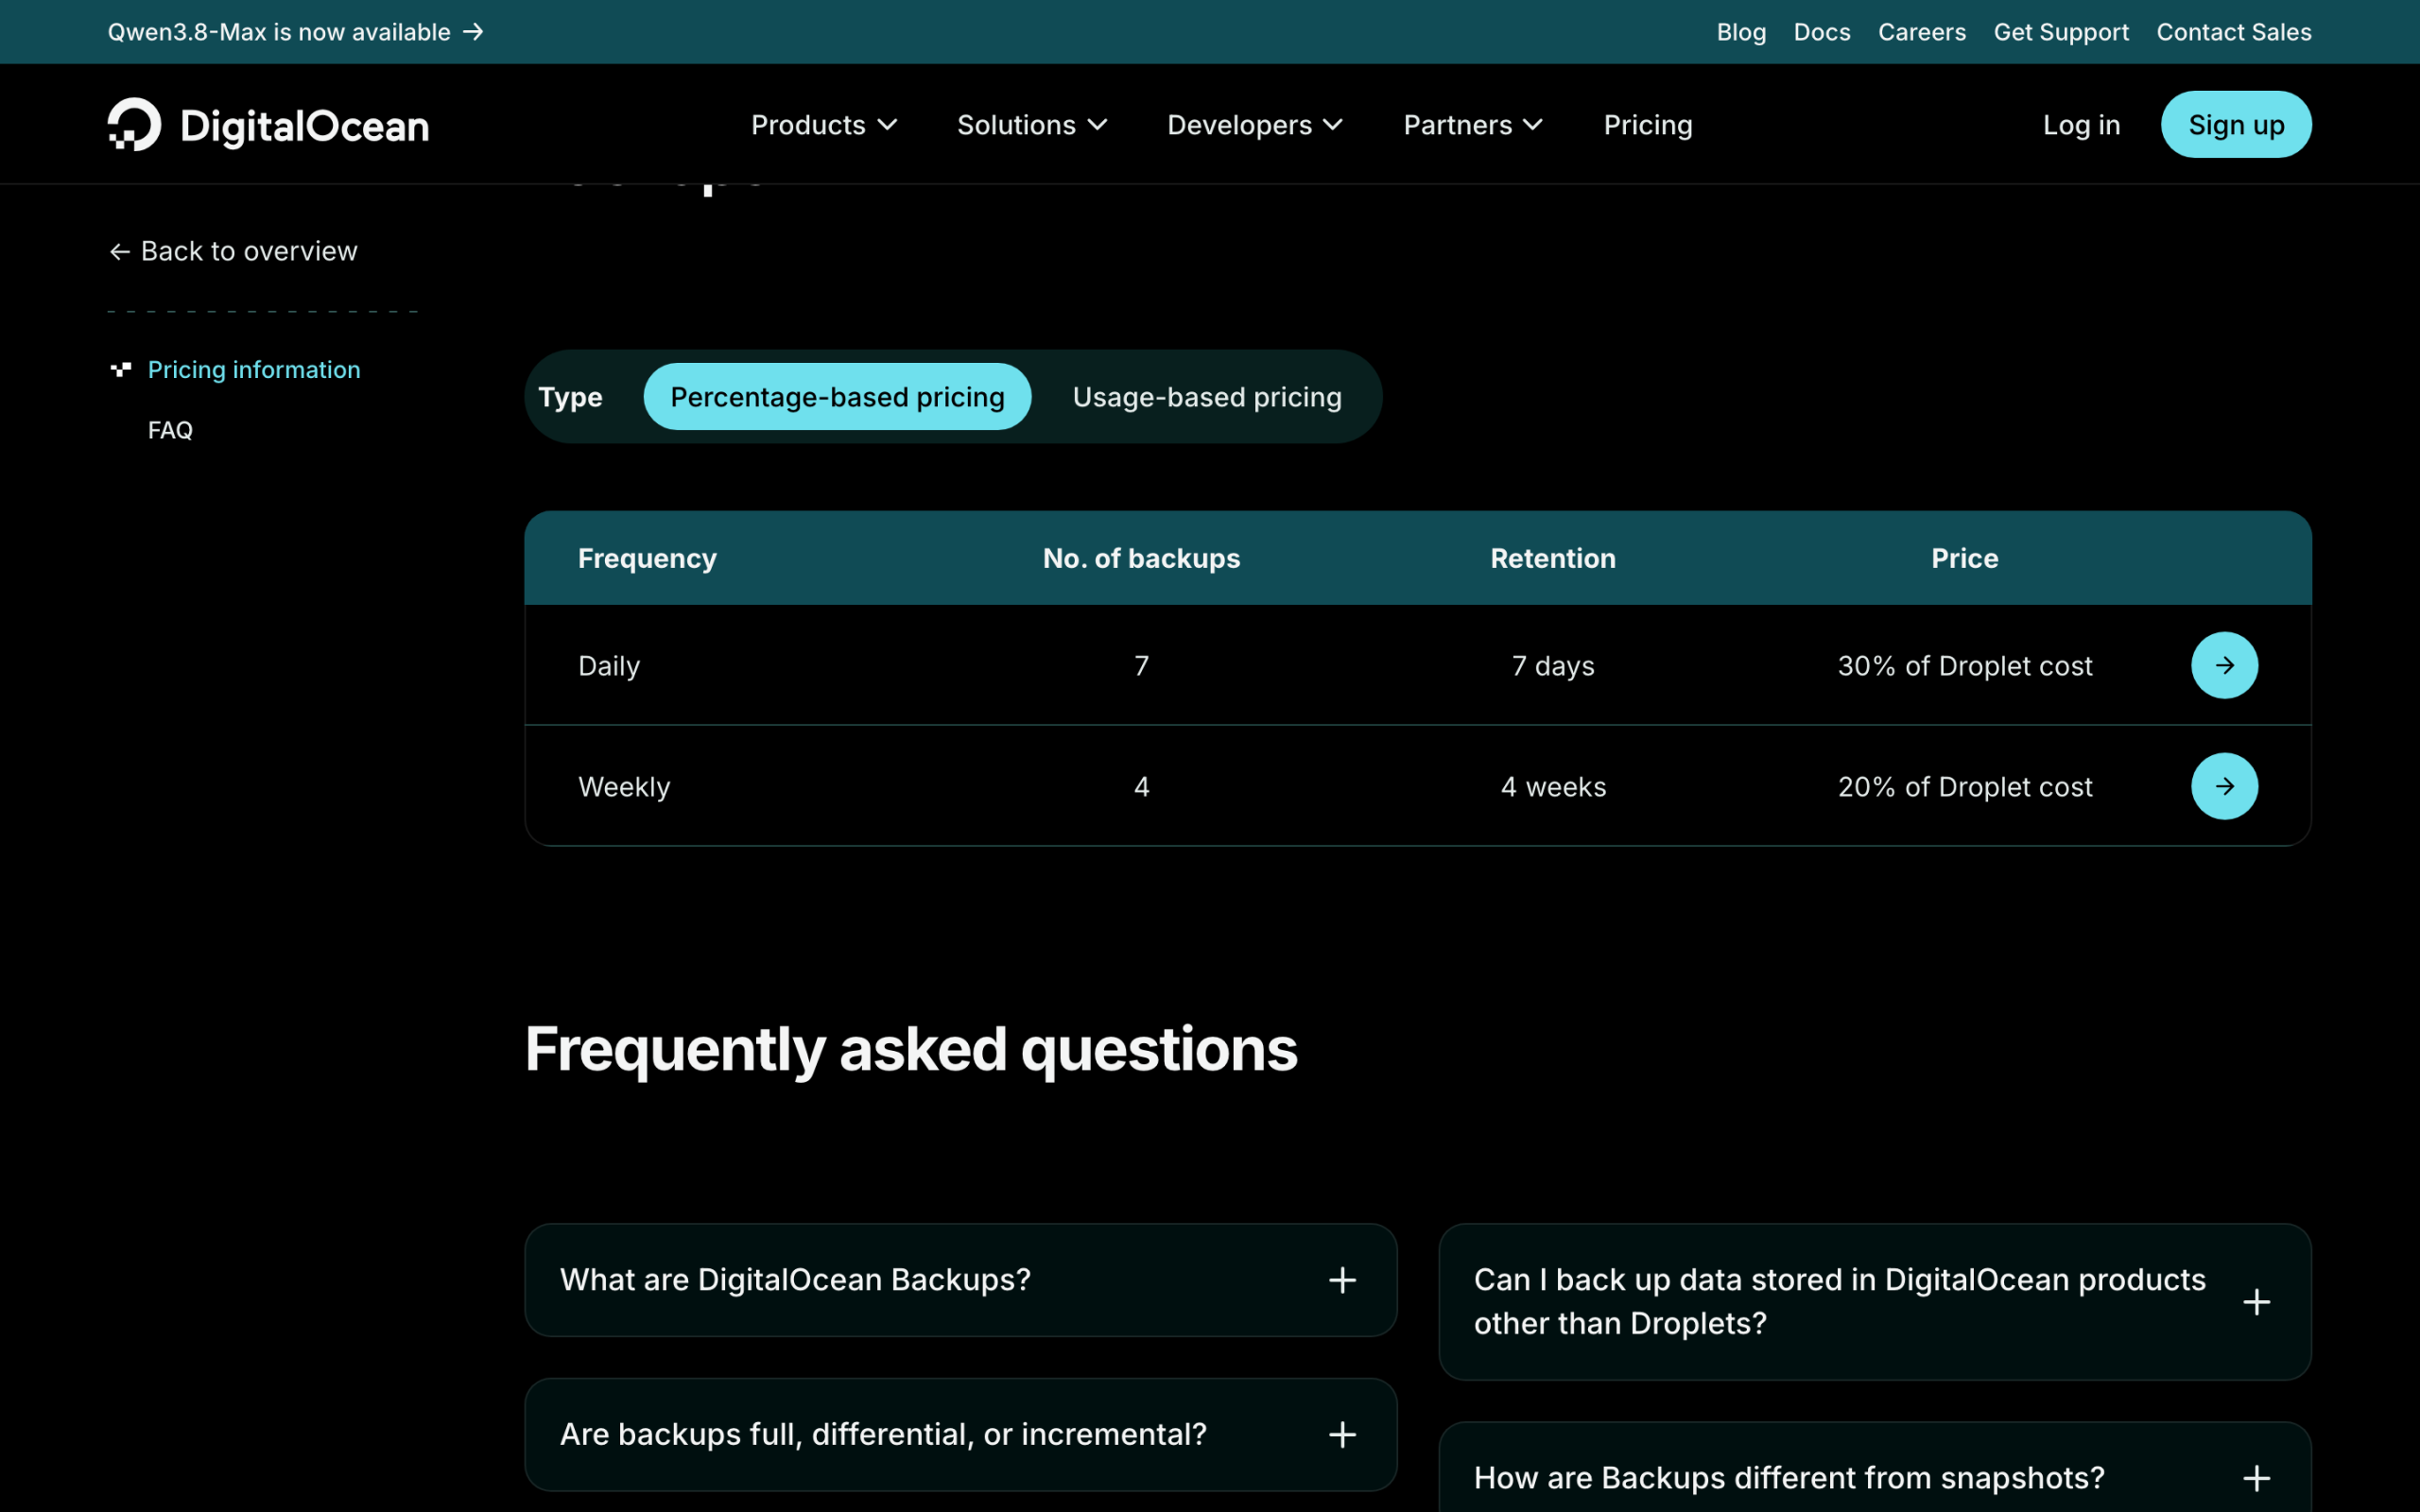
Daily: 7 backups, 7 days of retention, 30 percent of Droplet cost. Weekly: 4 backups, 4 weeks of retention, 20 percent of Droplet cost.
There is also a usage-based option starting at $0.01/GiB per month with frequencies up to every 4 hours and retention from 3 days to 6 months, and Droplet snapshots at $0.06/GB per month.
What that costs on the $48 machine
On the $48 machine that is $14.40 a month for daily or $9.60 for weekly. Note what drives it: the size of the Droplet, not the size of what you are protecting.
My analytics data is 4.36 MiB. My backup bill is calculated on 160 GiB of provisioned SSD.
Snapshots are priced differently again
Snapshots price on used disk instead. df -h / on my host shows 73G of 150G used, so a single snapshot at $0.06/GB is $4.38 a month, standing still.
Line 1 plus line 2, weekly backups: $57.60.
Line 3: monitoring, and the flaw in the free answer
Uptime Kuma, in two files
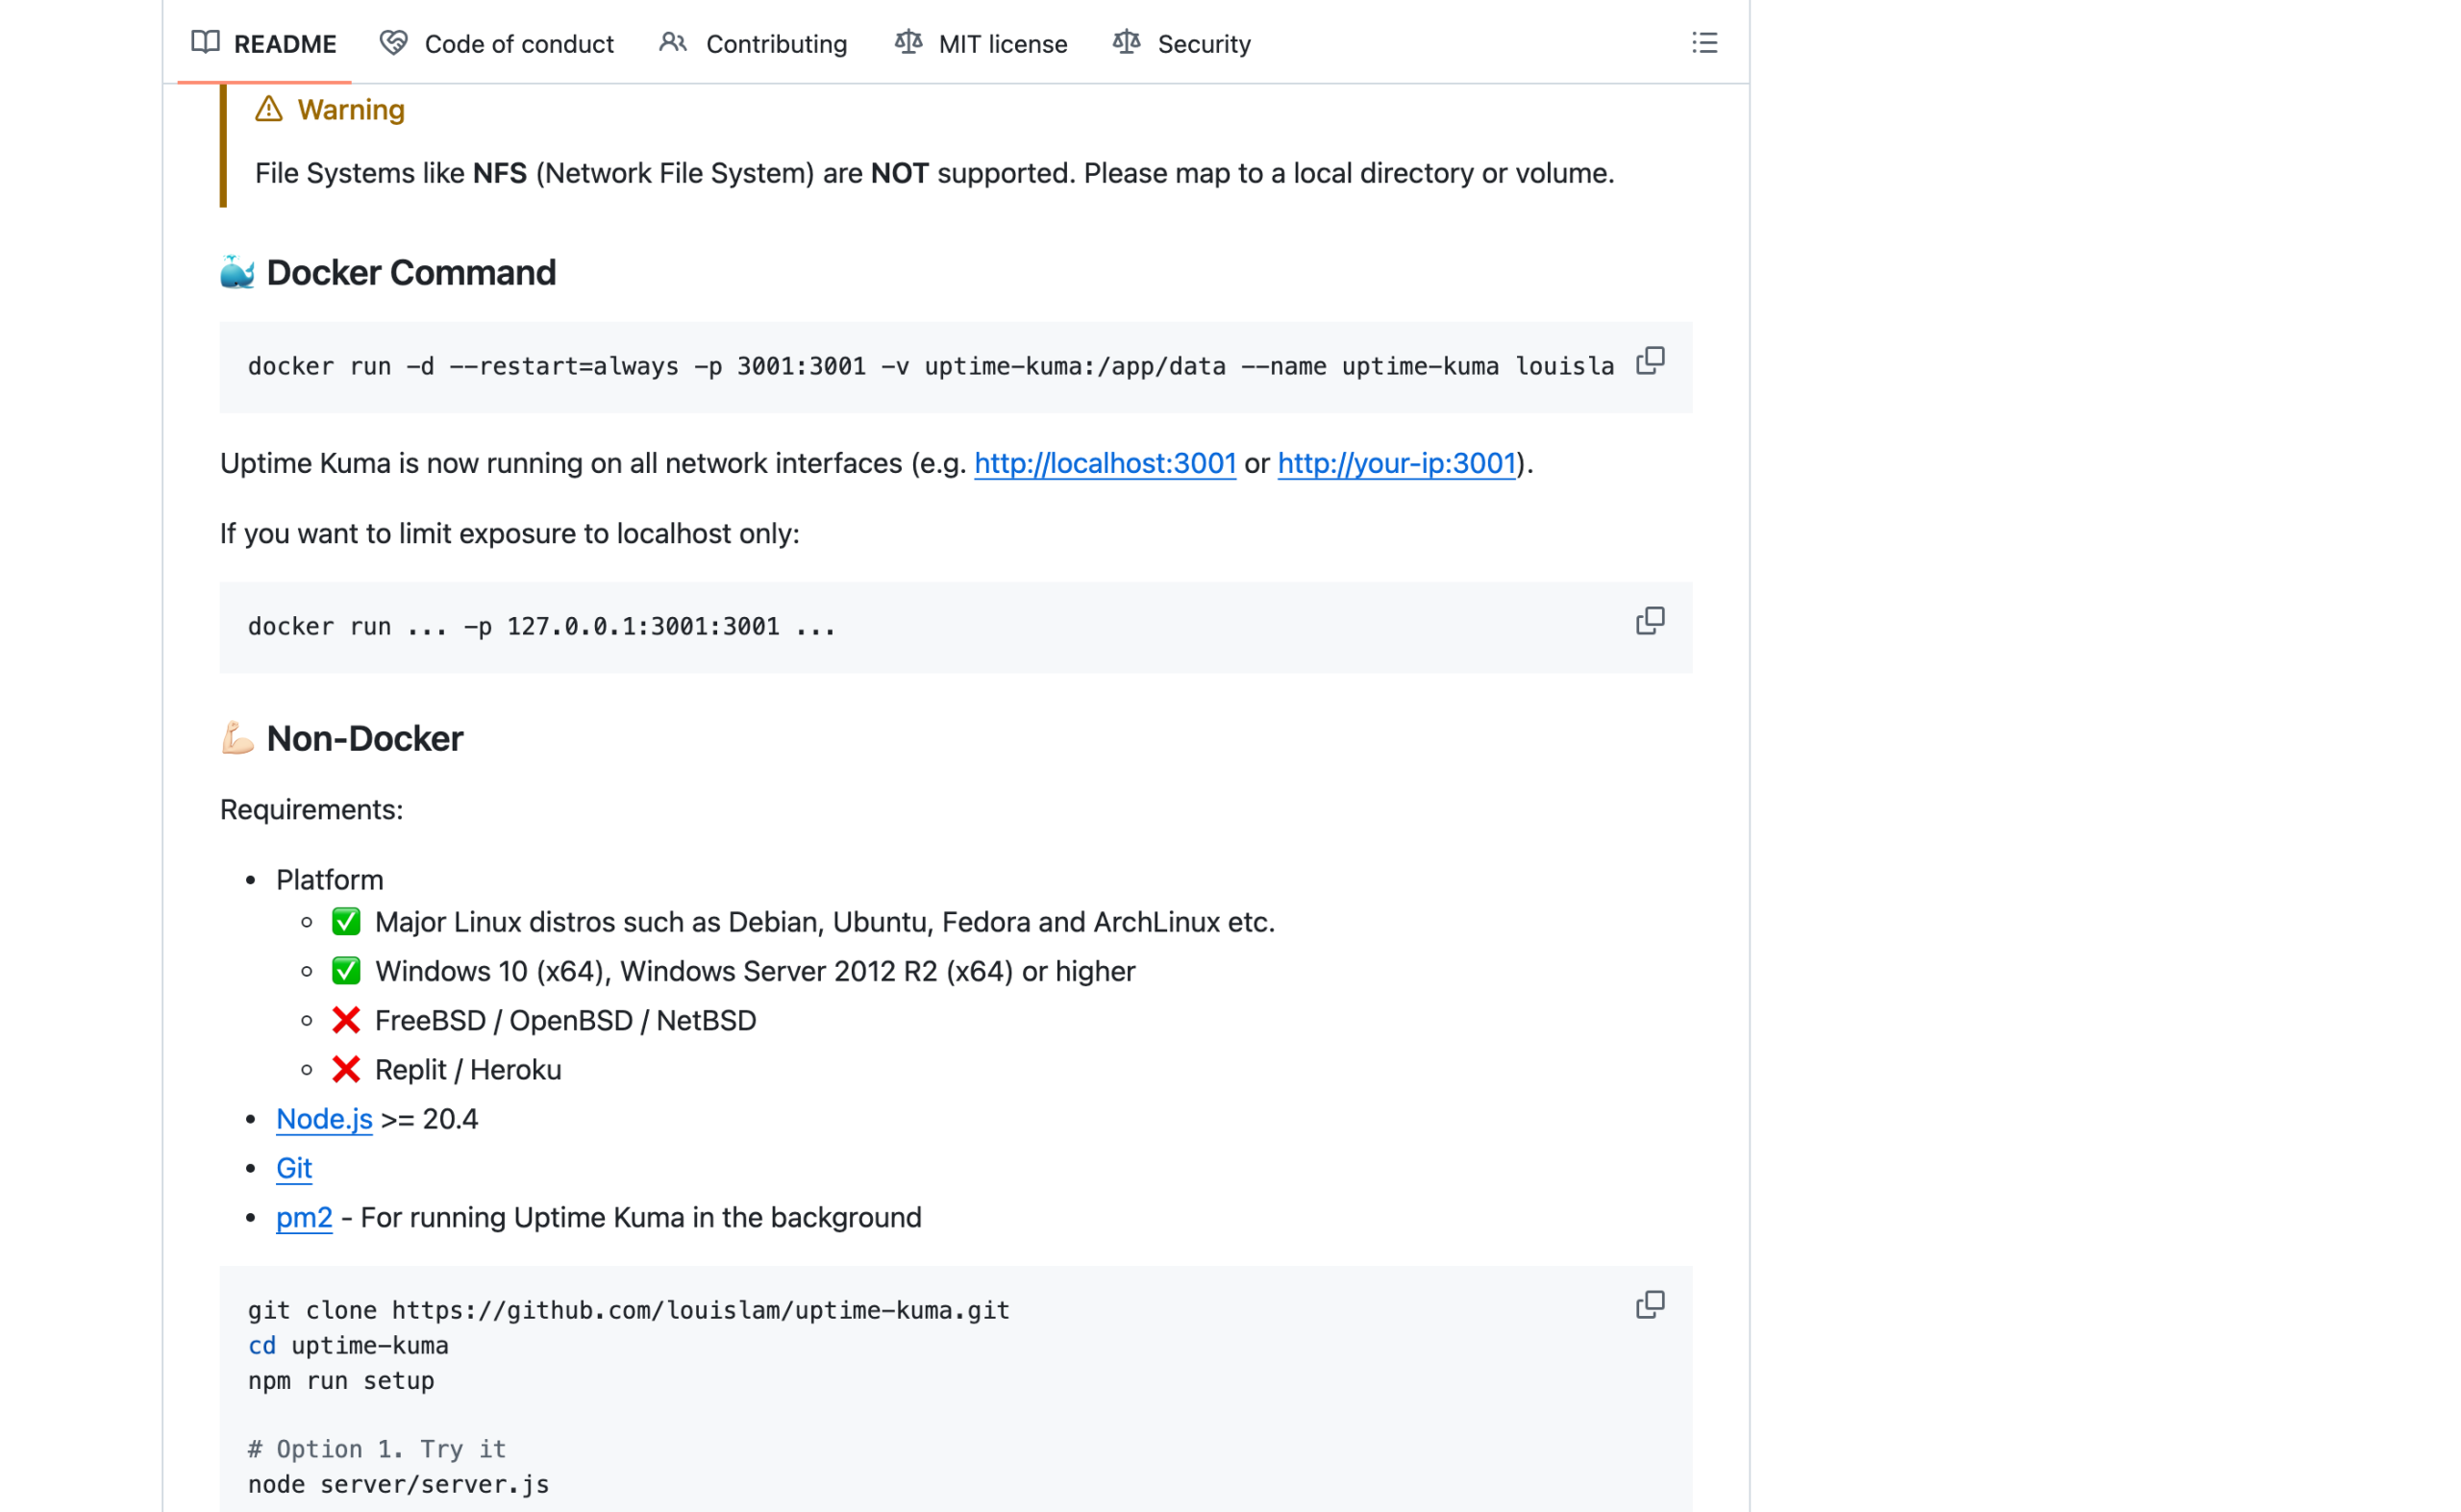
The self-hosted answer is Uptime Kuma, and it is genuinely good. Two files:
services:
  uptime-kuma:
    image: louislam/uptime-kuma:2
    restart: unless-stopped
    volumes:
      - ./data:/app/data
    ports:
      - "3001:3001"
HTTP, TCP, keyword, JSON query, ping, DNS, push and Docker container checks, 20-second intervals, 90-plus notification services, status pages. Cost in cash: zero.
The flaw in the free answer
Cost in honesty: if you run it on the box it is watching, it goes down with the box, and the alert you needed most is the one it cannot send.
That is not a criticism of the tool.
It is the structural problem with self-hosted monitoring, and the fix is another machine, which is another line item, or a hosted checker on the outside.
What the hosted checker costs
UptimeRobot’s free tier gives 50 monitors at zero, and their Solo plan is listed at €10 a month, or €9 on annual billing, with 10 monitors (uptimerobot.com/pricing, read 2 September 2026).
Their Team plan is €41 monthly or €35 annual. For most single-server setups the free tier genuinely covers it, so this line can be zero.
It is only zero if you set it up, and setting it up is line 4.
Line 4: your own attention, which I will count in events rather than invent a rate
Four things this box asked of me
Nobody can tell you what your hour is worth, and I am not going to make up a number and multiply it.
What I can do is list what this one server actually asked of me this year, each item verifiable from the box:
- ClickHouse has restarted five times.
docker inspectreportsRestartCount 5.OOMKilledis false on the current run, so I cannot attribute those to memory and I am not going to. - Every major search engine got suspended on 31 August 2026. My SearXNG settings.yml carries a dated comment: Added 2026-08-31 after brave/duckduckgo/google-cse/startpage all suspended. That was an evening rewriting the engine list to independent indexes.
- 8.3 GB of ClickHouse system logs, found today. Ten months of accumulation because my compose file does not mount the config Plausible’s own reference compose mounts. Nothing alerted. Nothing broke. It was simply true for ten months, and the full breakdown of that ClickHouse volume is its own post.
- A pinned image tag that was never applied, found today. The compose file says
v3.2.1;docker inspecton the running container sayslatest, built 15 May 2026.
Drift, not incidents
Two of those four I only found because I sat down to write this. That is the real shape of the cost.
It is drift rather than incidents, and you do not notice drift until you go looking. Put an hour a month against it and you are being optimistic.
Line 5: the incident, which I cannot show you
This is the part where a post like this usually tells you about the Saturday night the disk filled.
I do not have one to tell you about on this box, and inventing one would be worse than leaving the section thin.
uptime reports 121 days, and I have no recorded outage.
The near miss
What I can show you is the near miss, which is more useful anyway:
$ free -m
               total   used   free  shared  buff/cache  available
Mem:            7750   4386    356     455        3747        3363
Swap:           2047   1808    239
1,808 MiB of 2,047 MiB of swap in use. That machine has already spilled almost everything it can spill.
And docker stats shows two containers, FalkorDB and n8n, reporting 7.569GiB as their memory limit, which is Docker’s way of saying no limit was set.
Add a 3 GB ClickHouse log table growing quietly underneath and you have all three ingredients of an incident with none of them yet arranged in the right order.
Seven services, one kernel, one disk
The single-box risk is the one to price honestly. Seven services, one kernel, one disk. When it goes, all seven go, and your monitoring goes with them if you took the free option in line 3.
The other side of the ledger
Now the subscriptions this replaces, all read 2 September 2026:
| Service | Plan | Price |
|---|---|---|
| Plausible Cloud | Starter (1 site, 3 yr) | $9 / month |
| Plausible Cloud | Growth (3 sites) | $14 / month |
| Plausible Cloud | Business (10 sites, 5 yr) | $19 / month |
| Firecrawl | Standard, 100,000 credits | $83 / month |
| Firecrawl | Scale, 1,000,000 credits | $599 / month |
| Brave Search API | pay as you go | $5 per 1,000 requests |
What those prices assume
Plausible Cloud figures are at the pricing slider’s default position of 10,000 monthly pageviews and rise with traffic. Firecrawl credits do not roll over on self-serve plans. Brave includes $5 of free credits a month.
The arithmetic, done twice, with two different answers
Analytics, one small site
Analytics, one small site. Self-hosted needs a machine that meets the 2 GB the Plausible README asks for, so $12 a month minimum, plus $2.40 of weekly backups, plus the ten months I did not notice 8 GB of logs.
Plausible Cloud Starter is $9 and includes their operations team.
Cloud wins. I self-host anyway for two reasons that are worth money to me and might not be to you: no pageview meter, and a ClickHouse client I can point at the raw event table, which Cloud lists only under Enterprise.
Crawling and search
Crawling and search. My wrapper reported 505/2000 requests used on the day I wrote this, against a self-imposed ceiling of 2,000 a day.
Call it 15,000 fetches a month at current pace, 60,000 at the ceiling. Both fit inside Firecrawl’s Standard plan, so the hosted bill is a flat $83 a month either way.
If crawling were this box’s only job, Crawl4AI and SearXNG fit comfortably on the $24 line: they use 606 MiB and 82 MiB of RAM respectively and about 4.2 GB of image.
Add weekly backups and that is $28.80. Self-hosting wins by about 2.9x, and the gap widens with every extra request because one side is metered and the other is not.
That is the rule I would extract from the whole exercise, and it has nothing to do with ideology:
Self-host the things that are metered per unit of work and that you do a great deal of.
Pay for the things that are metered per seat or per site and that you do a little of. That is the only self-hosting heuristic I trust.
Why the answer splits
Crawling is metered per request and I make thousands. Analytics is metered per site and I have one. The maths follows from that, not from a preference.
The lines almost everyone leaves out
- Backups priced on the machine, not the data. 20 percent of a $48 Droplet is $9.60 whether you are protecting 4 MiB or 100 GB.
- Snapshot storage that never shrinks. $0.06/GB per month against used disk, and used disk only goes up.
- Log and image creep. 8.6 GB of ClickHouse on the server, 9.97 GB of images on the server, 67 GB of images and 27 GB of build cache on the laptop, most of it from local WordPress development environments. All of it silent.
- Egress ceilings. DigitalOcean’s included transfer runs from 500 GiB on the $4 plan to 6,000 GiB on the $96 plan. Fine for a crawler that mostly downloads, not fine if you start serving media.
- Monitoring that survives the outage. Free only if it lives somewhere else.
- The upgrade you keep postponing. A pinned tag is a promise, and
docker compose up -dis the moment it becomes true.
If you manage servers for other people, this is the same conversation as who pays for WordPress plugin subscriptions on client sites, one layer down.
Recurring cost is easy to see and easy to argue about. Recurring attention is neither, and it is the one that decides whether the arrangement lasts.
The operational side of that, at scale, is in managing WordPress sites for clients, and if backups are the line you are pricing right now, the WP Umbrella against Updraft Central comparison covers the hosted versions of that specific job.
Resources
- DigitalOcean Droplets pricing and Backups pricing. Both server-rendered, both quotable.
- Uptime Kuma, the self-hosted monitor, and its two-file compose.
- UptimeRobot pricing, for the hosted checker that survives your own outage.
- Plausible Cloud pricing, Firecrawl pricing, Brave Search API pricing.
One thing to do now
Take your monthly server bill, multiply it by 0.2, and write that number next to it. That is the backup line you probably are not paying and therefore probably do not have.
Then run docker system df and see how much of your disk is reclaimable.
Mine was 21.89 GB of images and 7.42 GB of build cache, on a machine I would have told you was clean.