Core Web Vitals for WordPress in 2026: The Thresholds, and What Actually Moves Them
On this page, 9 sections
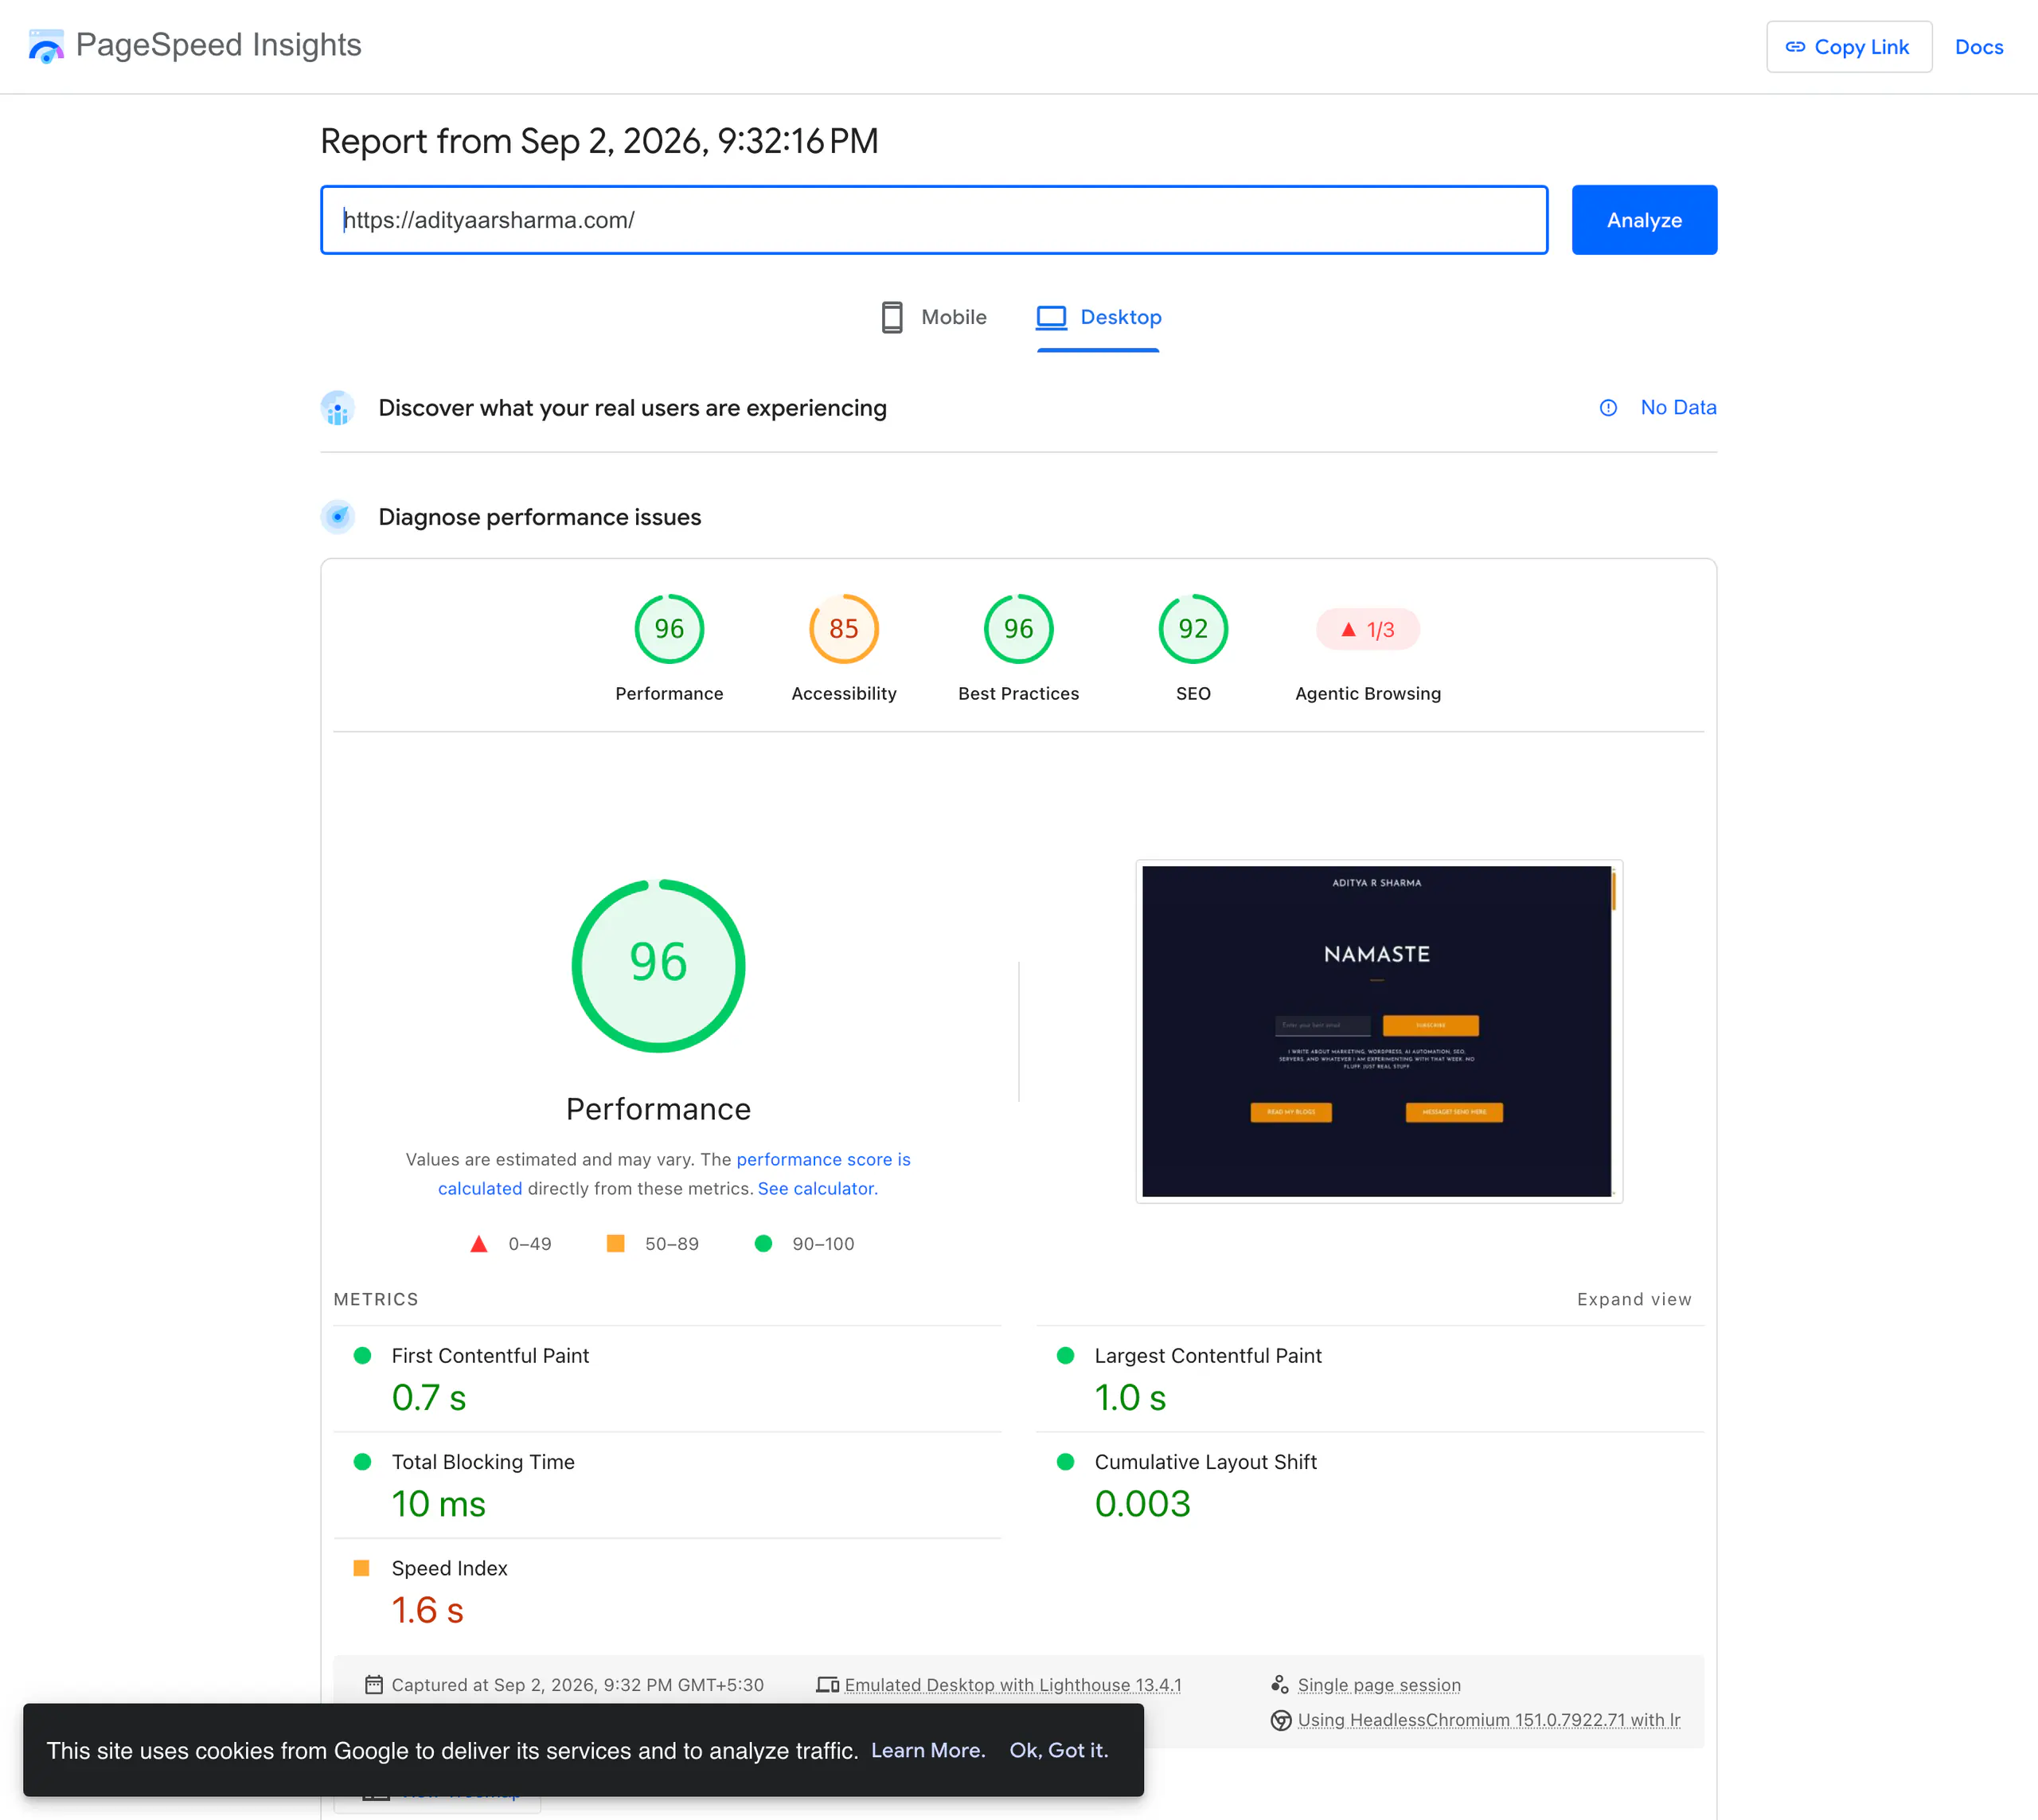
Same URL. Same PageSpeed report. Same second, 2 September 2026 at 21:32 IST. Desktop scored 96 with a Largest Contentful Paint of 1.0 seconds.
Mobile scored 79 with an LCP of 4.5 seconds. Nothing about the site changed between those two numbers. Only the emulated device did.
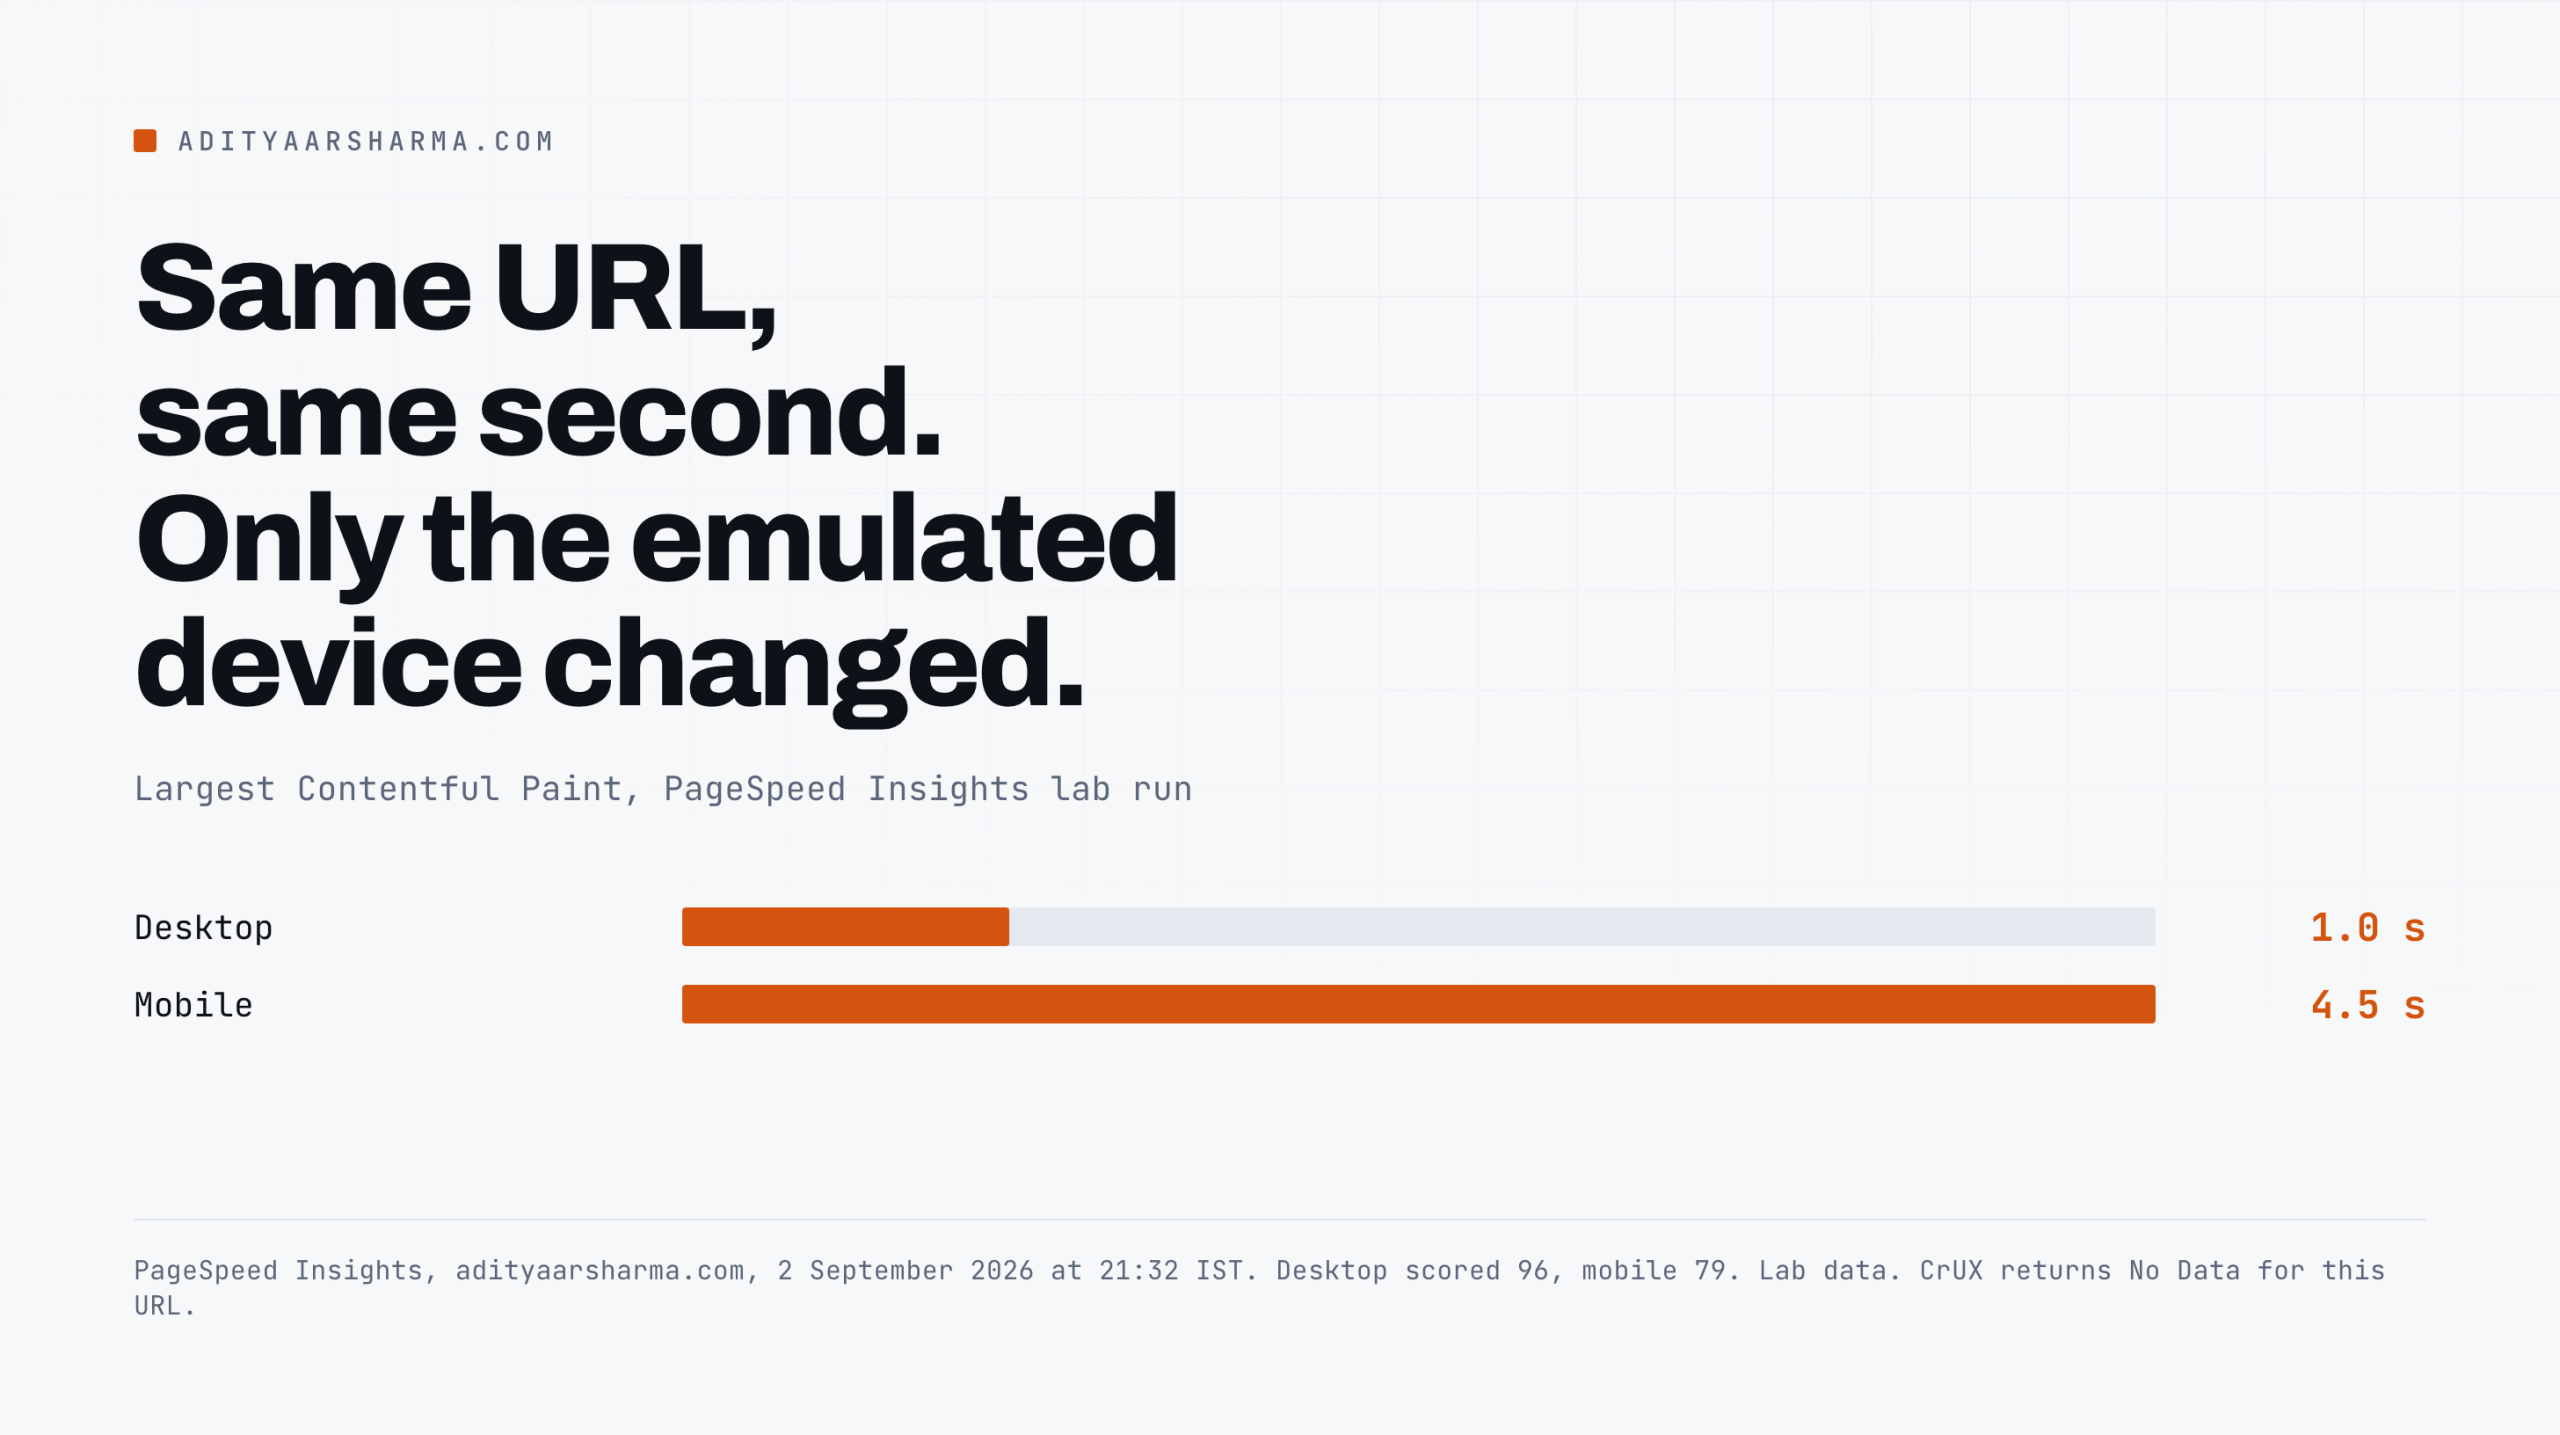
The gap is the device, not the site
4.5 seconds is a failing LCP. 1.0 second is a comfortable pass. If you have ever screenshotted your desktop score, you have shown someone a number that describes almost none of your traffic.
That is the first thing to fix, and it is free.
Below are the current thresholds with the date I read each page, where those numbers came from, and which of them a WordPress site can actually move.
I checked every figure against Google’s own documentation today rather than repeating what the tutorials say.
The thresholds, as published, with dates
| Metric | Good | Needs improvement | Poor | Page and date I read it |
|---|---|---|---|---|
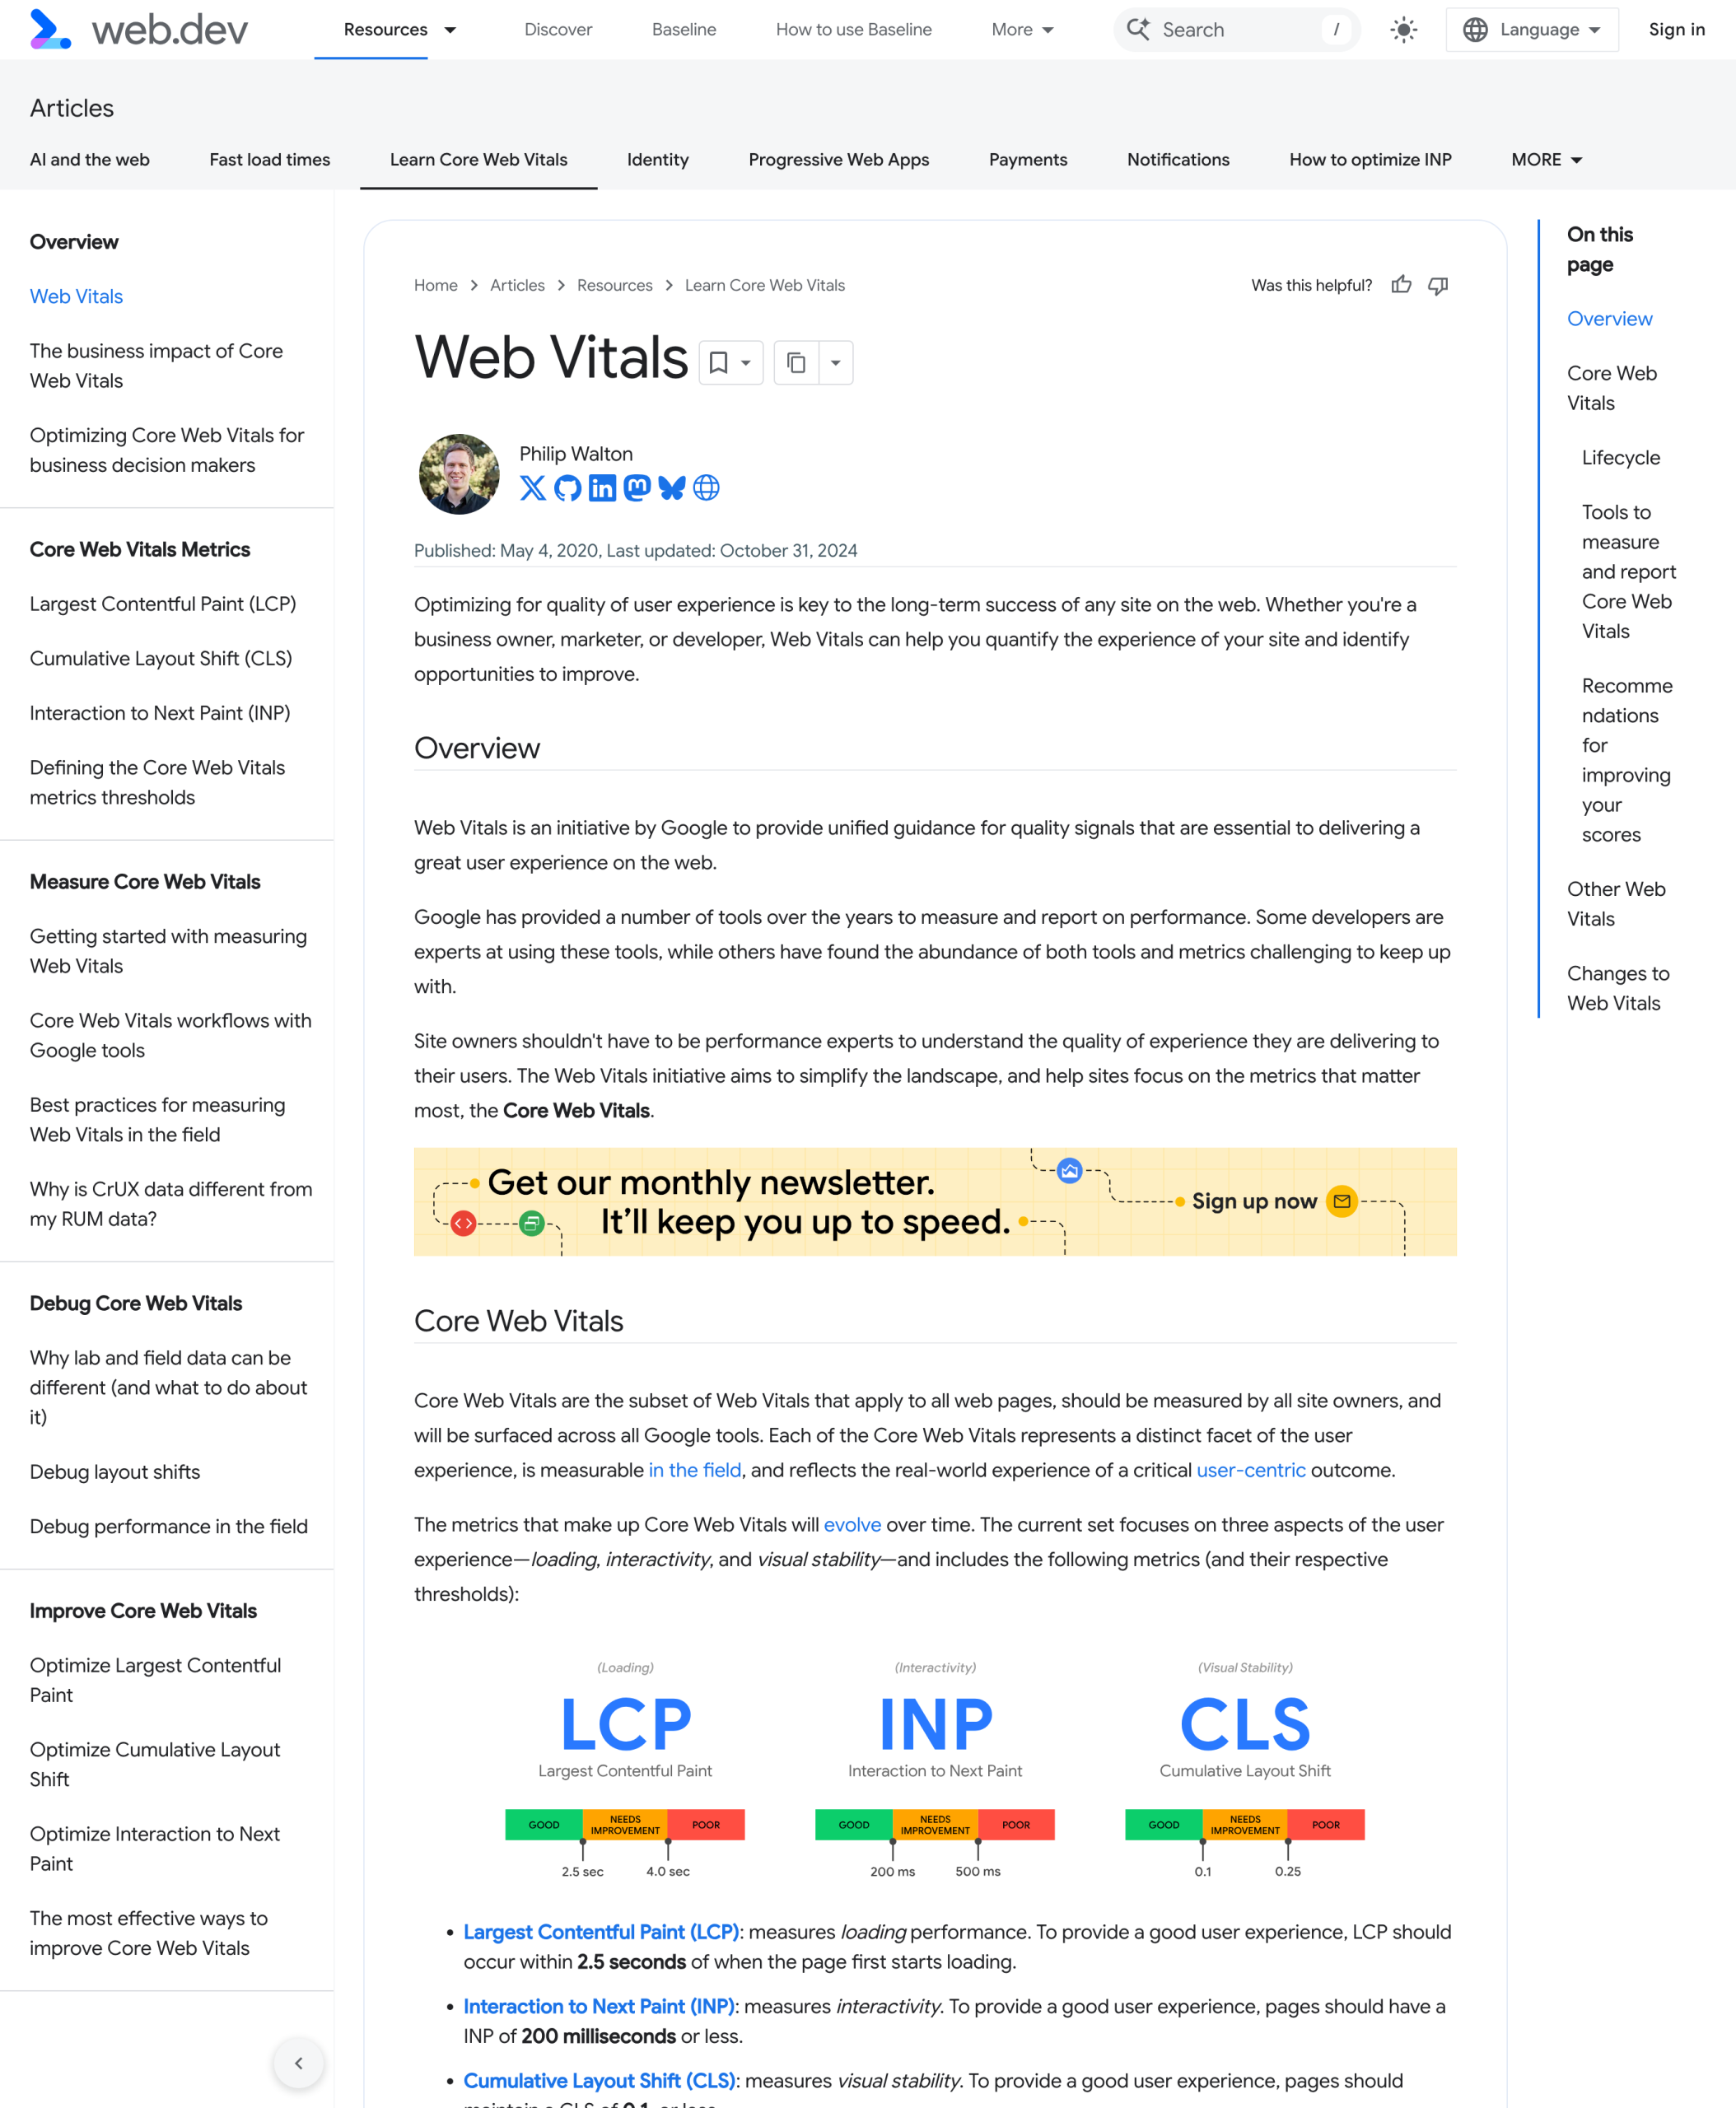
| Largest Contentful Paint | 2.5 s or less | 2.5 to 4.0 s | over 4.0 s | web.dev/articles/lcp, last updated 4 September 2025 |
| Interaction to Next Paint | 200 ms or less | 200 to 500 ms | over 500 ms | web.dev/articles/inp, last updated 2 September 2025 |
| Cumulative Layout Shift | 0.1 or less | 0.1 to 0.25 | over 0.25 | web.dev/articles/cls, last updated 12 April 2023 |
How the assessment actually works
All three are assessed at the 75th percentile of page loads, segmented across mobile and desktop. A page passes only if it meets all three at that percentile.
Those numbers have not moved in 2026. The set has not gained a fourth metric. If someone tells you the thresholds changed this year, ask them for the page and the date.
The one change: INP replaced FID in March 2024
The one real change since the last time most people looked is that Interaction to Next Paint replaced First Input Delay as a Core Web Vital on 12 March 2024.
Google announced it on web.dev in a post last updated 31 January 2024, and was blunt about the consequence: FID was deprecated and removed from the programme, dropped from Search Console on the same day, with a six-month deprecation window in PageSpeed Insights and the Chrome User Experience Report.
Why INP broke sites that had passed FID
This is the part worth understanding, because it explains a specific pattern in WordPress: sites that were green for years suddenly went amber and nothing had been installed.
What FID measured
First Input Delay measured only the delay between the first interaction and the moment the browser began processing it. It stopped the clock before your code ran.
A page could block the main thread for two seconds after the click and still post a fine FID, because the delay before processing was short.
What INP measures instead
Interaction to Next Paint measures the whole thing: input delay, plus the event handlers running, plus the browser painting the next frame that shows the result.
And it does not take the first interaction, it effectively reports the worst one across the visit.
What that catches on a WordPress site
On a WordPress site the difference is concrete.
A mega menu that runs a jQuery handler on click, a tabbed section from a page builder that rebuilds its markup, a search box that fires an admin-ajax request before painting anything, a cookie banner that recalculates layout: all of these passed FID and all of them are exactly what INP was built to catch.
The metric did not get harsher. It started measuring the part that was always slow.
Where 200 ms comes from
Google’s threshold document is honest that 200 ms is not arbitrary.
It traces the number back through Jakob Nielsen’s response-time limits to Miller, and to Michotte’s 1962 work on the perception of causality, in which participants stopped perceiving one object as having caused another to move once the delay passed roughly 200 milliseconds.
Past that, a click stops feeling like it did anything.
Where the thresholds came from, which nobody quotes
Google published its reasoning in Defining the Core Web Vitals metrics thresholds, last updated 7 May 2025. It is the most useful page in the whole set and almost nothing links to it.
Three things in it change how you should read your own score.
The good threshold is what good sites can hit
The good threshold is set by what good sites can actually hit. For LCP the team tested 1.5, 2, 2.5 and 3 seconds against top-performing origins and found that 1.5 and 2 seconds are not consistently achievable, while 2.5 seconds is.
So 2.5 s is not a physiological limit. It is the tightest number that well-built sites reach at the 75th percentile.
The poor threshold is a quota
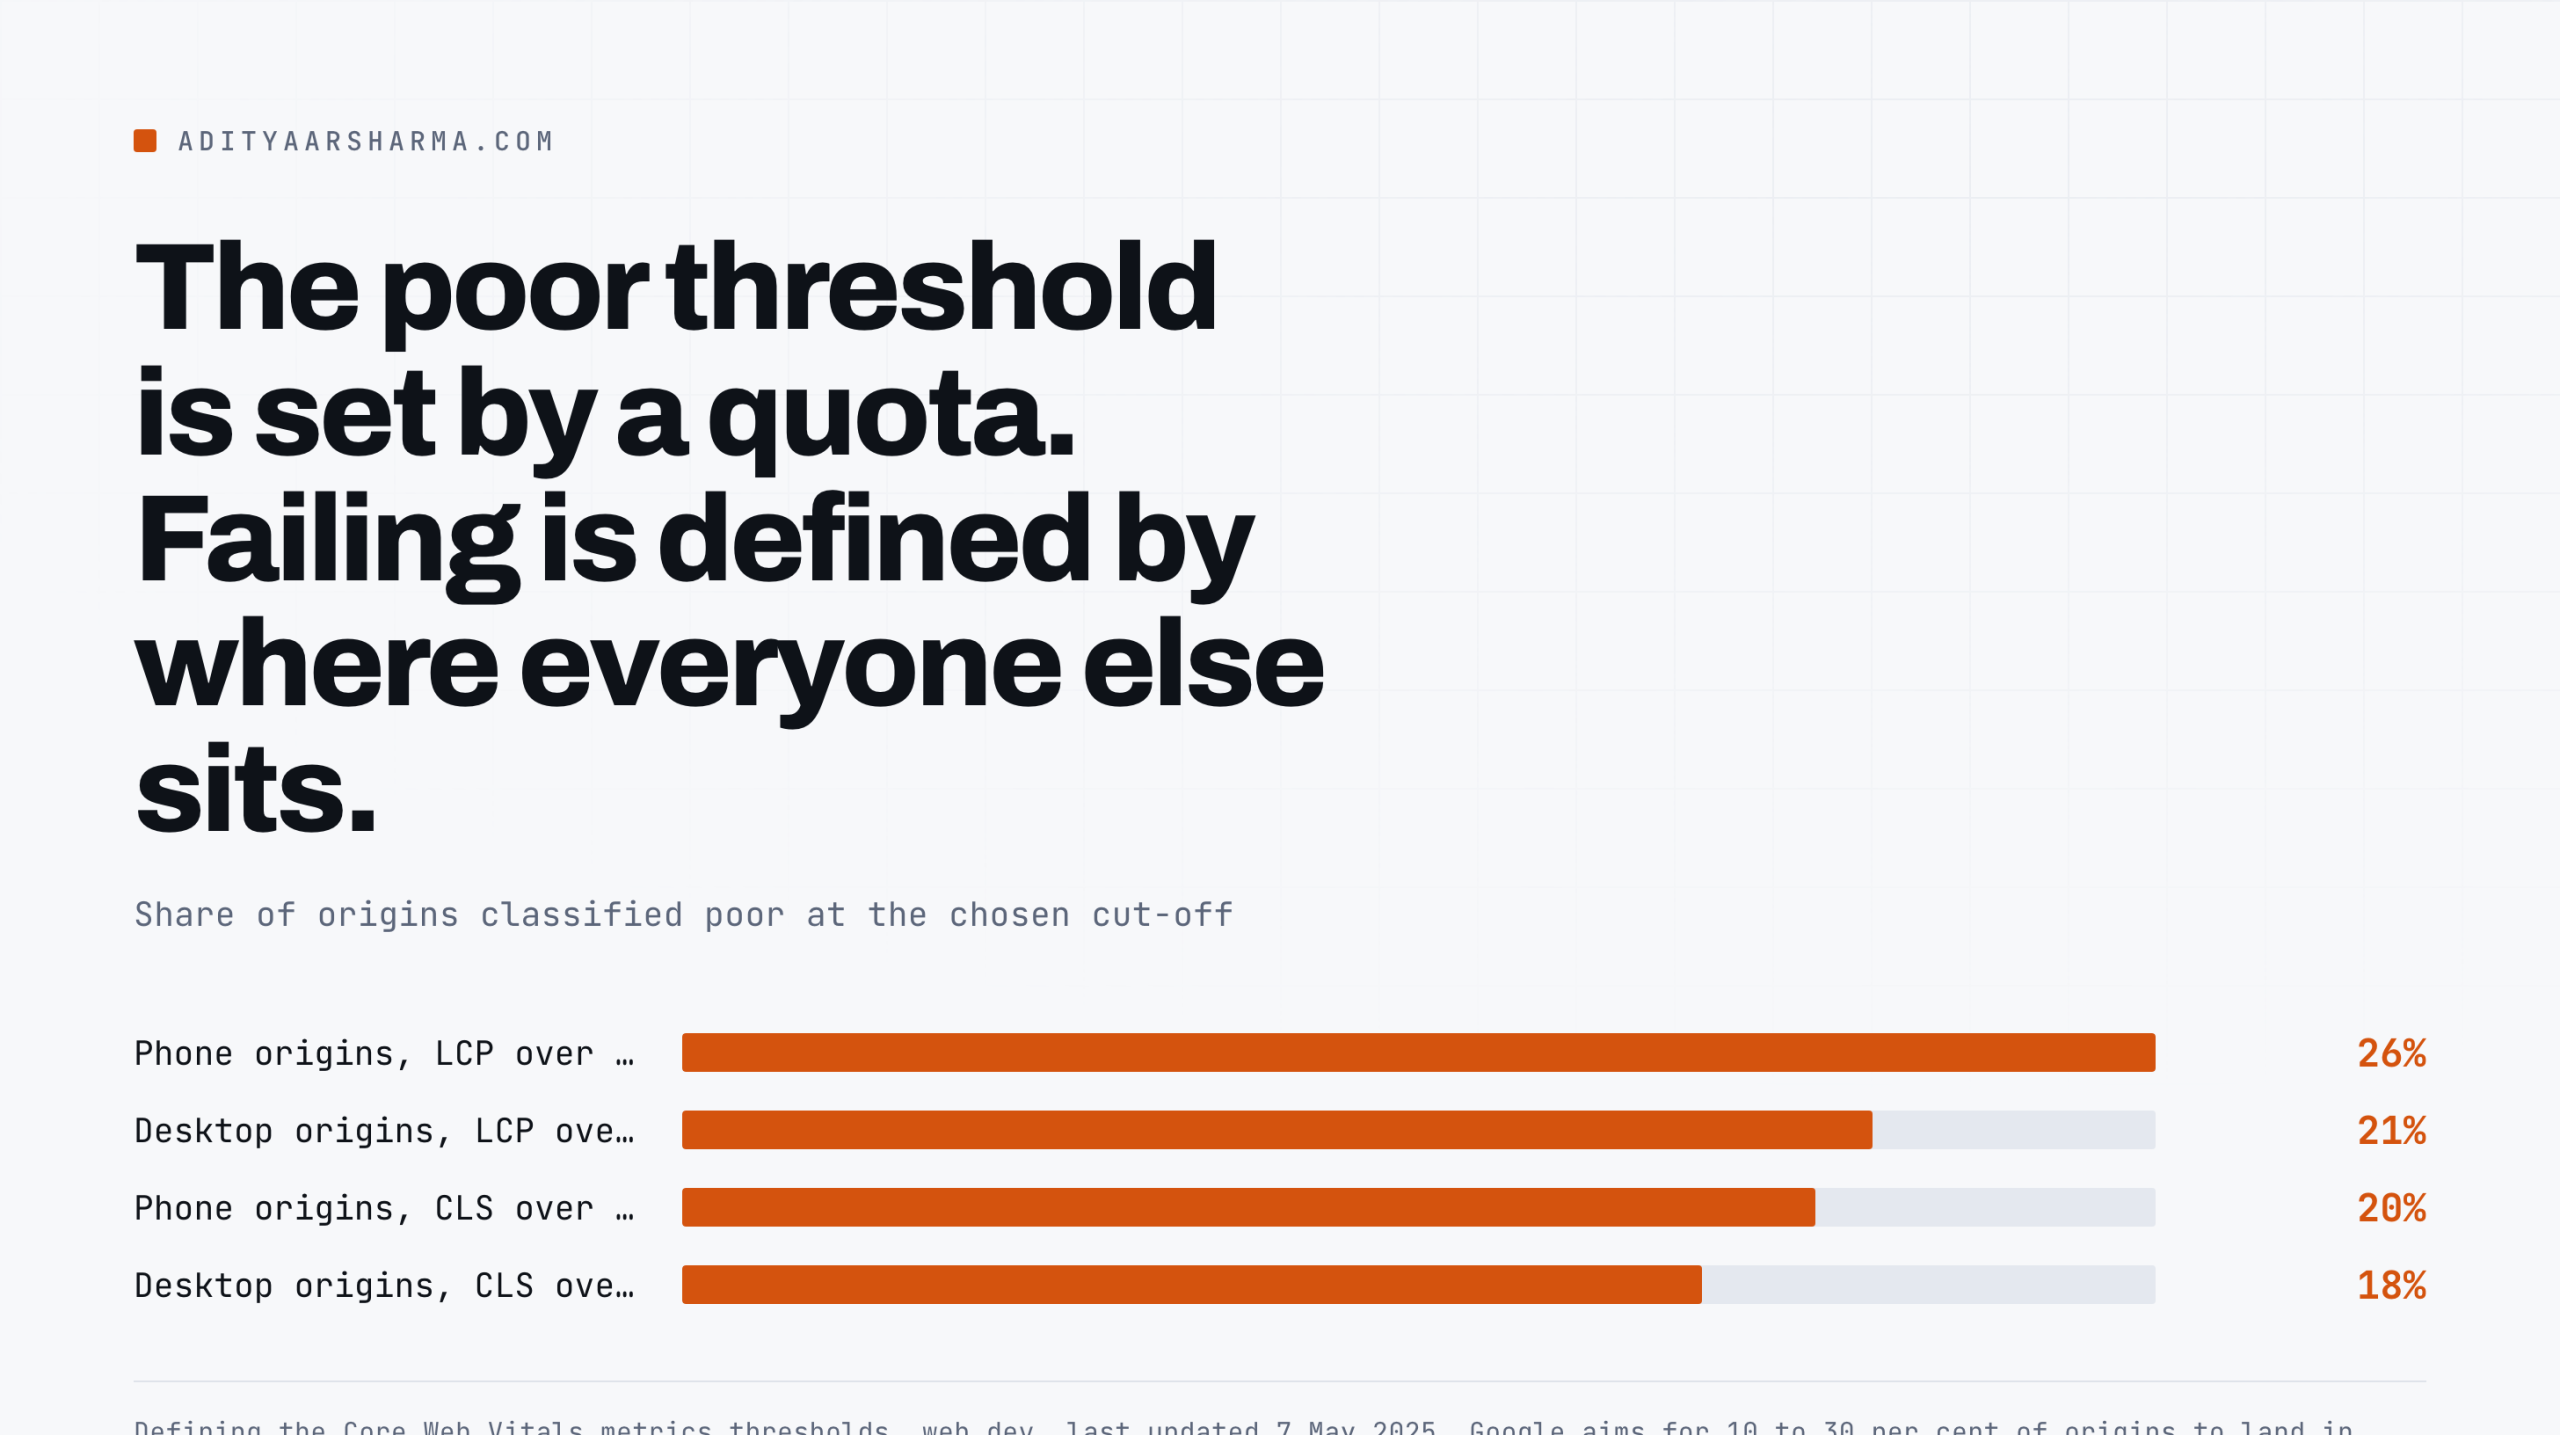
The poor threshold is set by a quota. Google aims for 10 to 30 percent of origins to land in poor.
At a 4 second LCP cut-off, roughly 26 percent of phone origins and 21 percent of desktop origins are classified poor, which is inside the target band, so 4 seconds was accepted.
CLS at 0.25 puts about 20 percent of phone origins and 18 percent of desktop origins in poor. Failing is defined partly by where everyone else sits.
CLS is lenient because of embeds
CLS is deliberately lenient, and the reason is third-party embeds. Google’s own testing found shifts of 0.15 and above were consistently perceived as disruptive, and CrUX data suggested 0.05 was a reasonable good threshold.
They chose 0.1 anyway, writing that for embedded content the height is often unknown until it loads.
Every WordPress site with a Twitter embed, a YouTube card or an ad slot is the reason your CLS budget is as generous as it is.
Why the 75th percentile and not the 95th
The 75th percentile itself was a trade. A higher percentile describes more of your visitors but gets dragged around by outliers: at the 95th, five bad samples out of a hundred visits decide your grade.
At the 75th, it takes twenty-five.
The number PageSpeed shows you is not the number Google grades you on
Look at the top of my own report again. Under Discover what your real users are experiencing, it says No Data. Not slow, not fast. Nothing at all.
What No Data means
That is the Chrome User Experience Report saying my site does not have enough Chrome traffic to produce a field sample. Core Web Vitals thresholds are field thresholds, assessed on real visits at the 75th percentile.
If CrUX has no data for your URL, none of the three metrics has a value for you in the sense Google uses.
What you get instead is the lab section, and my report labels its own conditions in small grey text at the bottom of the metrics panel:
Captured at Sep 2, 2026, 9:32 PM GMT+5:30. Emulated Moto G Power with Lighthouse 13.4.1. Single page session. Using HeadlessChromium 151.0.7922.71.
PageSpeed Insights run conditions, read from the report on 2 September 2026
One page load. One emulated mid-range Android. One simulated network. That is a diagnostic, and a good one.
It is not a measurement of your audience, and treating a lab score as a Core Web Vitals grade is the single most common mistake in WordPress performance work.
Two consequences, both actionable
Two consequences follow, and both are actionable. First, a small WordPress site will often never appear in Search Console’s Core Web Vitals report at all, because CrUX needs volume.
Second, the only way such a site gets real numbers is to collect them itself, from its own visitors, with the web-vitals library:
<script type="module">
import {onLCP, onINP, onCLS} from 'https://unpkg.com/web-vitals@4?module';
const send = m => navigator.sendBeacon('/wp-json/mysite/v1/vitals',
  JSON.stringify({name: m.name, value: m.value, id: m.id,
                  rating: m.rating, path: location.pathname}));
onLCP(send); onINP(send); onCLS(send);
</script>
Three callbacks, a beacon, and a REST route to store them. Once that is running you have your own 75th percentile per template, which is the number that actually tells you whether a change worked.
Everything before that is guessing with a nicer interface.
What moves each metric on a WordPress site, and what does not
Grouped by metric, because the mistake I see most often is applying an LCP fix to an INP problem and concluding that performance work does not help.
| Metric | What moves it on WordPress | What does not |
|---|---|---|
| LCP | The hero image: correct size, fetchpriority="high", and never lazy-loaded. Server or edge response time for the document. Render-blocking stylesheets in the head. | Minifying JavaScript. Deferring scripts that were already below the fold. An object cache, if your page cache is already hitting. |
| INP | Third-party tags that run handlers. Page-builder interactivity, accordions, tabs, mega menus. admin-ajax calls fired on click. DOM depth, because style recalculation walks the tree. | Image compression. A CDN. Anything that only affects how fast bytes arrive rather than what runs after a click. |
| CLS | Missing width and height on images and iframes. Web fonts swapping without a matched fallback metric. Cookie banners and ad slots injected above existing content. | Server speed. Caching of any kind. A faster host will shift the layout just as much, sooner. |
The asymmetry in what gets sold to you
The asymmetry is the useful bit. Almost every WordPress performance product sells you LCP work, because caching and image handling are easy to package.
INP is the one that needs someone to open the performance panel and look at what a click actually costs, and CLS is usually a CSS defect rather than an infrastructure one.
If you want to see the LCP half of this done live on a real site rather than described, I recorded a full pass:

The best explanation of CLS is five years old
For the CLS side, the clearest explanation I know of comes from the Chrome engineer who built the metric.
Annie Sullivan’s talk Understanding Cumulative Layout Shift, posted on the estellevw channel from #PerfMatters Conference 2020, walks through why the score is impact fraction times distance fraction rather than a simple pixel count.
It is cited by web.dev’s own CLS article, which is how I found it. It is five years old and it has not been improved on.
Three things I could not verify, so I am not claiming them
- Whether any of this affects your rankings, and by how much. Google says page experience is a signal. Nobody outside Google can isolate its weight. Anyone showing you a ranking lift from a Core Web Vitals fix is showing you a correlation with a confound.
- My own field numbers. CrUX returns No Data for adityaarsharma.com, so I have no 75th percentile to report for my own site. Every figure I gave for it is lab.
- What the thresholds will be next year. Google’s own Web Vitals page says the set will evolve and CLS documentation floats a stricter 0.05 in a future iteration. Floating is not announcing.
Do this in the next ten minutes
Open PageSpeed Insights on your most-visited template, not your homepage, and read only two things. First, whether the field section says No Data.
If it does, your score is a lab simulation and your next move is to collect real numbers, not to change a setting. Second, the mobile LCP, ignoring the score entirely.
The question that decides your week
Then ask the question that actually decides your week: is my mobile LCP above 4.0 seconds? If it is, you have a document-delivery or hero-image problem and it is worth days of work.
If it is under 2.5 and the site still feels slow, your problem is INP, and no amount of caching will touch it.
Related reading
- The measurements behind the numbers here, run with curl against this same site: what actually makes a WordPress site slow.
- The hero image is the LCP element on most WordPress templates, and this is the free way to get its weight down: how to compress WordPress images in bulk.
- Layout shift often starts as a CSS rule that never applied in the first place: how to fix media query not working in WordPress.
- Unexplained gaps at the top of a template are a layout-shift source worth removing before you chase CLS: how to remove top and bottom white space on WordPress.
- Redirect chains add a full round trip in front of the document and land directly on LCP: how to fix 301 errors in WordPress.
Resources
- Web Vitals, web.dev, last updated 31 October 2024.
- Defining the Core Web Vitals metrics thresholds, web.dev, last updated 7 May 2025. Every number in the reasoning section above comes from here.
- Largest Contentful Paint, last updated 4 September 2025.
- Interaction to Next Paint, last updated 2 September 2025.
- Cumulative Layout Shift, last updated 12 April 2023.
- Interaction to Next Paint becomes a Core Web Vital on March 12, last updated 31 January 2024.
- GoogleChrome/web-vitals, the library in the field-measurement snippet.
- Chrome User Experience Report, the field dataset behind every threshold.