What Actually Makes a WordPress Site Slow, Measured on a Real Site
On this page, 10 sections
I ran this against my own homepage six times tonight, 2 September 2026:
curl -s -o /dev/null -D h.txt \
  -w 'ttfb=%{time_starttransfer} connect=%{time_connect}\n' \
  https://adityaarsharma.com/
grep -i 'x-runcloud-cache\|cf-cache-status' h.txt
Time to first byte came back at 0.687, 1.073, 1.004, 0.488, 1.030 and 1.572 seconds. Median around one second. Every one of those requests returned x-runcloud-cache: HIT.
The page cache was working perfectly and the page still took a second to start arriving.
That is the finding, and it is inconvenient because I am the one who configured this site. The slow part of my WordPress site is not WordPress.
It is not PHP, not the database, not a plugin doing something stupid on init. I can prove that with one more command, and the proof takes about thirty seconds to run on your site too.
Prove PHP is not the problem in one command
A page cache HIT means PHP barely ran. But barely is not zero, so I removed WordPress from the path completely.
I requested a plain static stylesheet, 5,829 bytes, with a random query string on the end so Cloudflare could not serve it from the edge and had to fetch it from my origin server.
The loop was four curl runs against hello-elementor/assets/css/reset.css with ?bust=$RANDOM$RANDOM on the end, printing time_starttransfer and the cf-cache-status header each time, with a two second sleep between them.
Four runs, all cf-cache-status: MISS: 1.448s, 0.580s, 0.786s, 0.612s. A static file. No PHP, no MySQL, no plugins, no theme. Nginx opening a file and sending 5,829 bytes.
It still took between half a second and one and a half seconds to return the first byte.
The same file, served from the edge
The same file served from the Cloudflare edge, on a HIT, came back in 0.225 seconds with a 0.065 second connect time. So the edge is 65 milliseconds away from me and the origin is roughly another 400 to 1,200 milliseconds beyond that.
| What was served | Cache state | TTFB measured 2 Sep 2026 |
|---|---|---|
| 5,829 B static CSS | Cloudflare edge HIT | 0.225 s |
| 5,829 B static CSS | Cloudflare MISS, forced to origin | 0.580 to 1.448 s |
| 170,466 B homepage HTML | WordPress page cache HIT at origin | 0.488 to 1.572 s |
| Same homepage, per Lighthouse | Google datacentre, emulated network | 50 ms |
Read the last two rows together
Read the last two rows next to each other. Serving a 5.8 KB static file from my origin costs about the same as serving a 170 KB cached WordPress page from my origin.
The variable is not what is being served. It is the trip.
Which means the entire genre of advice I have been reading for a decade, install a caching plugin, switch to PHP 8.4, add an object cache, would have moved my TTFB by close to nothing.
The work was already cached. The distance was the cost.
Why Lighthouse says 50 ms and my terminal says 1,000 ms
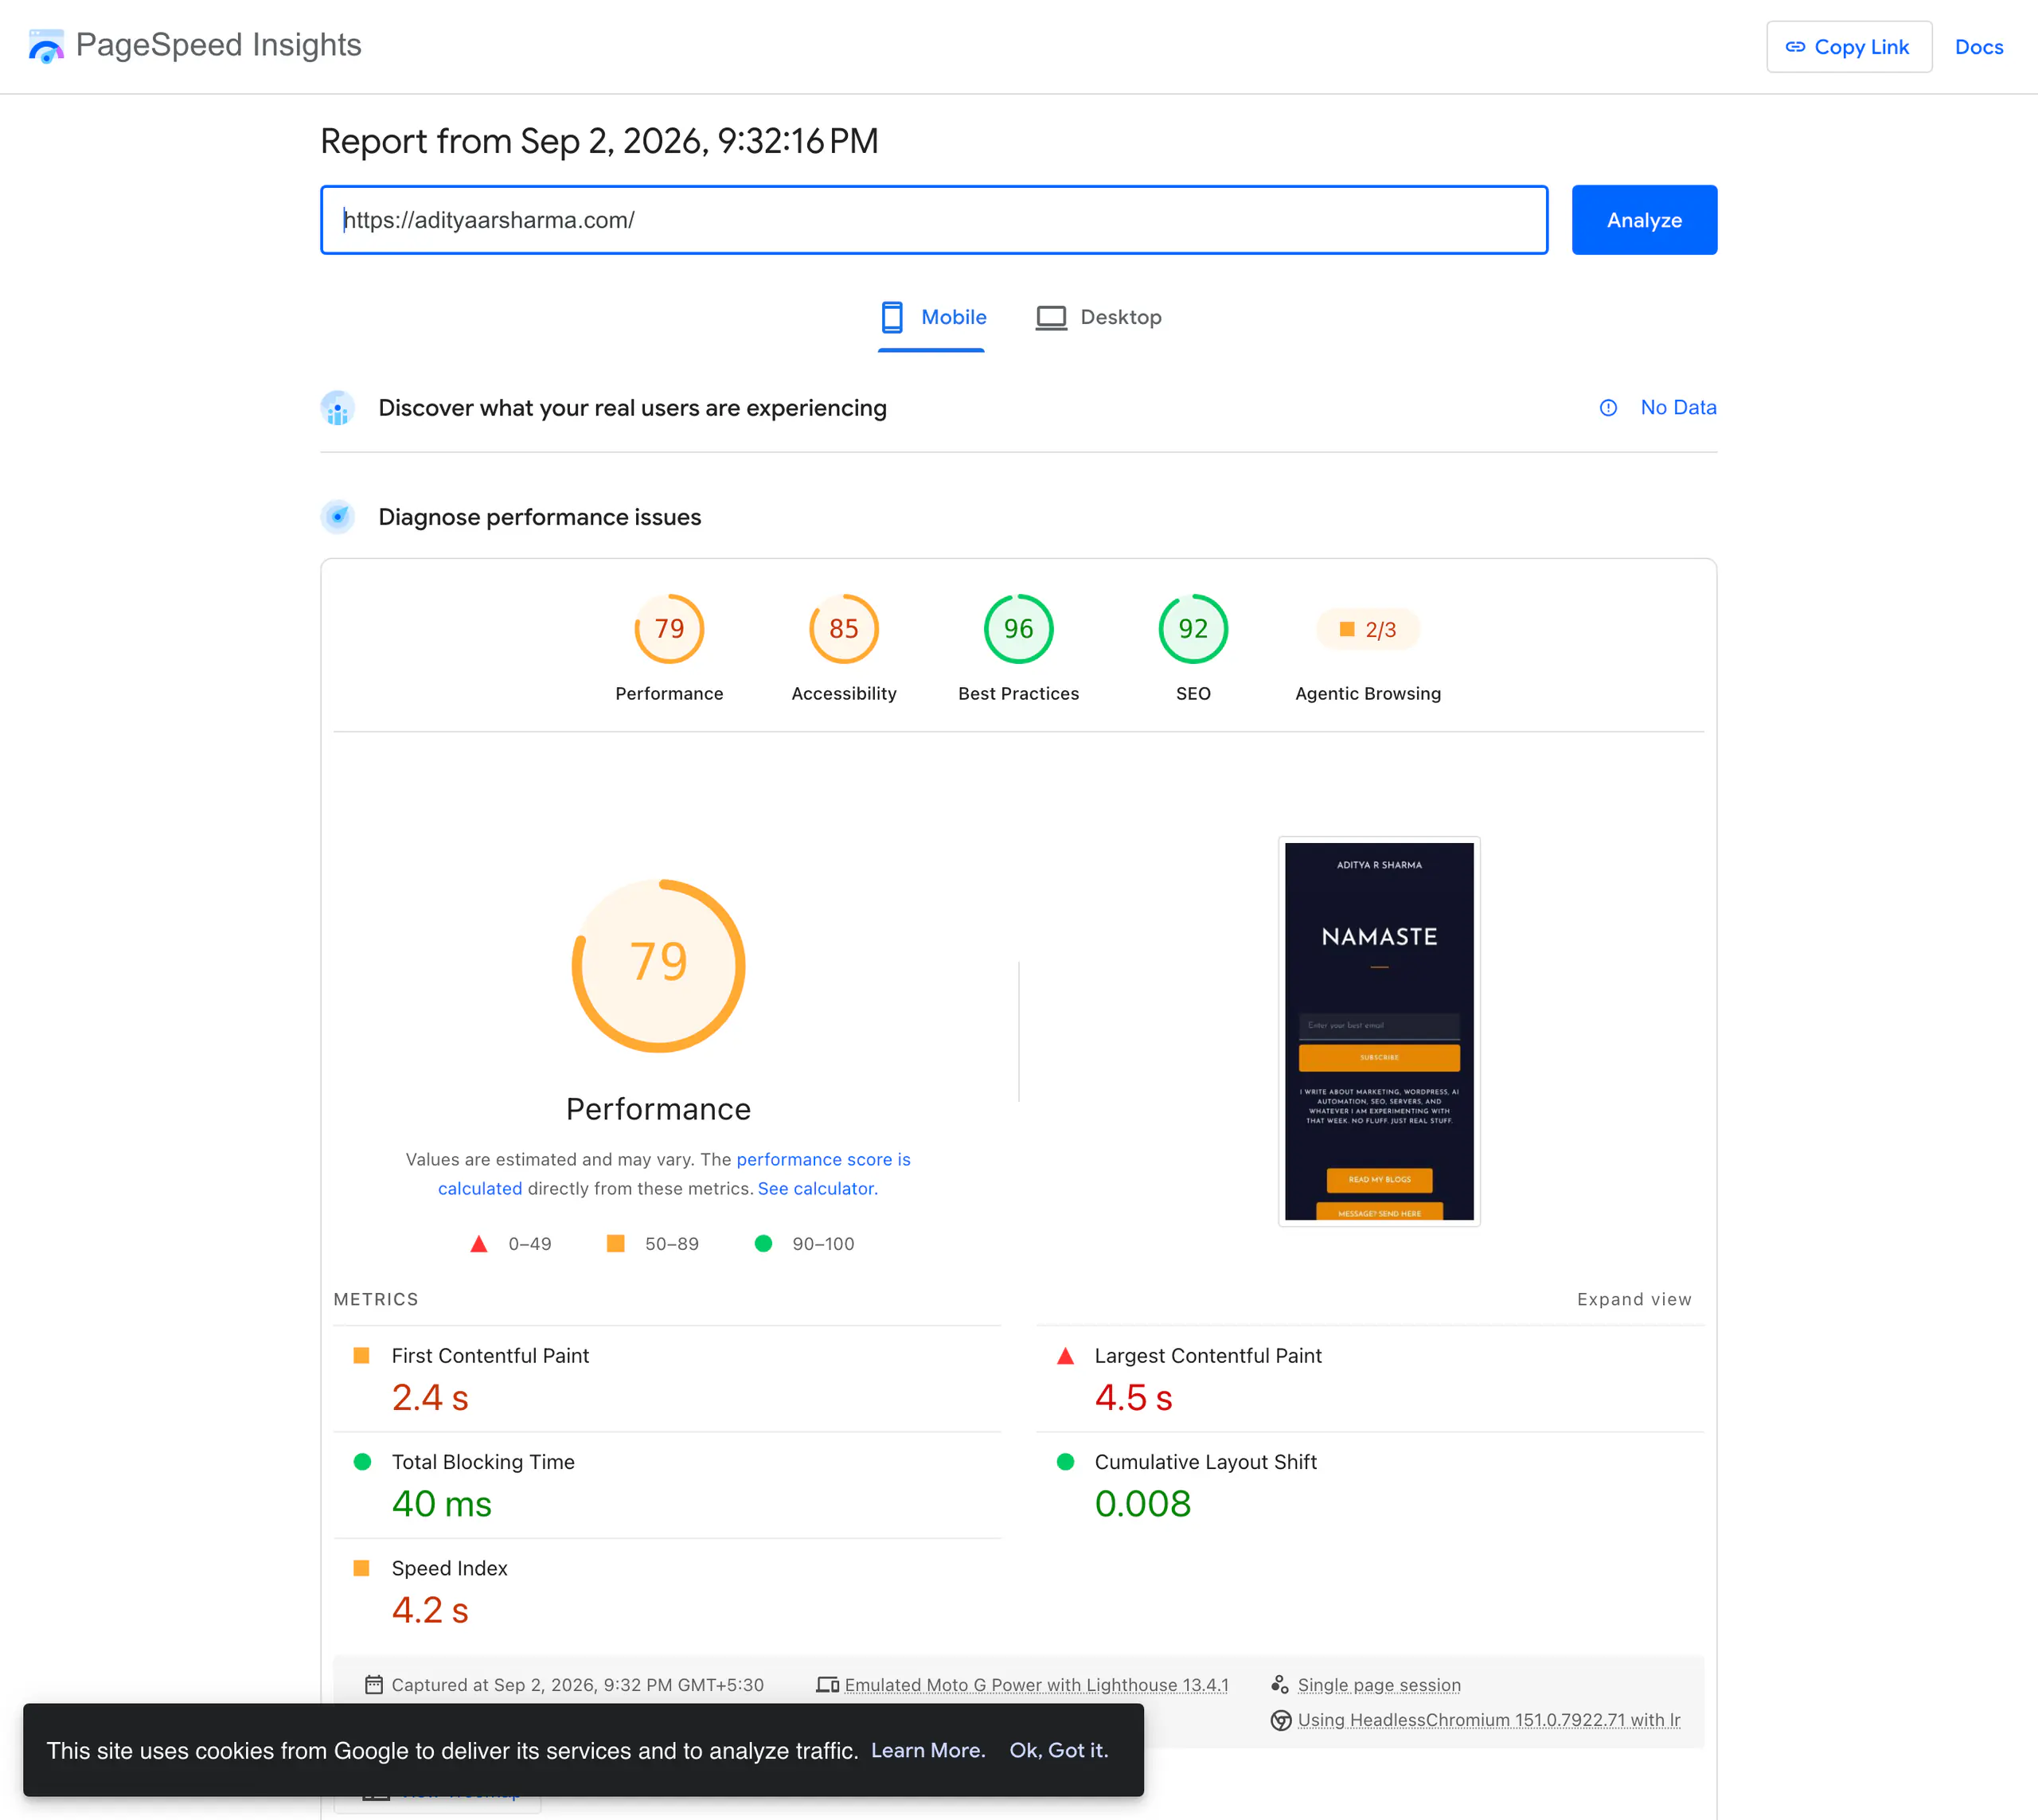
Lighthouse reported Root document took 50 ms in the same run where my terminal measured roughly a second. Both numbers are correct.
Lighthouse ran from a Google datacentre and applied simulated network throttling to the transfer, not to the round trip that reaches your origin. Its server response figure tells you how long your server took once the request arrived.
It does not tell you how long the request took to get there.

Why your PageSpeed score looks fine
If you have ever looked at a green server response time in PageSpeed while your visitors complain the site is slow, that gap is the reason.
The fix for it is not on your server. It is either an edge that caches your HTML, or an origin closer to your readers.
The actual defect: DYNAMIC on every HTML request
On my site Cloudflare is in front of the domain and returns cf-cache-status: DYNAMIC on every HTML request, which means it caches none of my HTML and passes every page view through to origin.
That is the actual defect.
I wrote about the layers and how to tell which one is failing in a companion piece, and the short version is that a page cache and a CDN cache are different caches and only one of mine is doing anything.
Then I counted the bytes, and it was not WordPress either
Second measurement. Every stylesheet and script the homepage requests, fetched twice, once with Accept-Encoding: identity and once with gzip, so I get both the real file size and what actually crosses the wire.
It counts <link rel=stylesheet> and <script src=> in the saved HTML, then fetches each file twice with -H 'Accept-Encoding: gzip' and -H 'Accept-Encoding: identity', printing size_download both times.
27 stylesheets. 41 script tags, of which 16 turned out to be inline scripts that a plugin had rewritten into data:text/javascript;base64 URIs, leaving 25 real network requests. 52 files on the render path. Total 1,367,827 bytes uncompressed, 375,551 bytes gzipped.
The largest file on the page belongs to Google
Here is the part I did not expect. Sorted by gzipped weight, the largest single file on my WordPress homepage belongs to Google:
| File | Uncompressed | Gzipped | Share of all CSS and JS |
|---|---|---|---|
| googletagmanager.com/gtag/js | 520,085 B | 174,628 B | 46.5% |
| platform.twitter.com/widgets.js | 93,967 B | 27,731 B | 7.4% |
| jquery 3.7.1 (WordPress core) | 87,553 B | 30,272 B | 8.1% |
| Elementor 4.2.2 frontend.min.js | 32,098 B | 10,399 B | 2.8% |
| Elementor 4.2.2 frontend.min.css | 54,666 B | 7,212 B | 1.9% |
Four third-party files carry 205,436 of the 375,551 gzipped bytes. That is 54.7 percent of the CSS and JavaScript weight of a WordPress site, and none of it is WordPress, the theme, or a page builder.
The Google Analytics tag alone outweighs jQuery, Elementor’s stylesheet and Elementor’s script combined, by a factor of three.
What I am and am not telling you to do
I am not going to tell you to remove analytics.
I am going to tell you that if you spent last weekend shaving 8 KB off a theme stylesheet while a 174 KB analytics tag sat two lines above it in the head, you were optimising the wrong file.
Measure before you cut. That is the entire point of this post.
Three bugs the measurement found on my own site
Running your own numbers has a side effect. It shows you things you would never have looked for.
Bug one: Plausible loaded twice
One. Plausible was loaded twice. Two byte-identical script tags in the same document. Same data-domain, same defer, same fetchpriority="low".
That was 1,321 gzipped bytes wasted and, more to the point, a second network connection for no reason.
The cause took longer to find than the symptom. Perfmatters was injecting the tag through its header code setting, and an Elementor Pro custom code snippet, post 2322, was injecting the same tag on elementor_head.
Two plugins, two different injection points, one duplicate. That is the lesson worth keeping: a duplicated asset is rarely one plugin misbehaving, it is two systems that each believe they own the tag.
I set the snippet to draft. Counting analytics.adityaarsharma.com/js/script.js in the live HTML now returns 1, checked 3 September 2026.
Bug two: a stylesheet with nothing in it
Two. A stylesheet that contains nothing. One of the minification cache files returned a valid HTTP 200 with content-length: 0 and a last-modified date of 26 August.
I published that as a minifier bug. That was wrong, and the real cause is a better story.
The child theme enqueued hello-elementor/style.css as parent-style. That file is a header comment and nothing else. It contains zero CSS rules.
So the minifier did exactly the right thing. Given a source file with no rules in it, a zero byte output is correct. The file was empty because the source was empty.
There was a second identical case, 20d77e3c2655.style.min.css, from the same enqueue. I removed the enqueue and both URLs now return 404, checked 3 September 2026.
Nothing in any dashboard would ever have told me this. Only counting the files did.
Bug three: brotli losing to gzip
Three. Brotli is losing to gzip. Same HTML, four encodings, requested back to back:
| Accept-Encoding | Bytes returned |
|---|---|
| identity | 170,466 |
| gzip | 33,075 |
| br | 33,392 |
| zstd | 33,427 |
Brotli returned 317 more bytes than gzip. That is not a broken CDN, it is compression level.
Brotli at a high level beats gzip comfortably, but an edge compressing dynamic responses on the fly uses a low level to keep latency down, and at low levels the two are a coin toss.
Worth knowing before you read a vendor page claiming brotli saves you 20 percent.
The DOM, where a page builder actually costs you
Last measurement, and this one needs a real browser because the count that matters is the rendered tree, not the HTML source. Open the page, then run this in the console:
let max = 0;
const walk = (el, d) => { if (d > max) max = d;
  for (const c of el.children) walk(c, d + 1); };
walk(document.body, 0);

({ bodyElements: document.body.getElementsByTagName('*').length,
   divs:         document.querySelectorAll('div').length,
   maxDepth:     max });
My homepage: 879 elements in the body, 522 of them div, maximum nesting depth 17.
What Chrome says the limits are
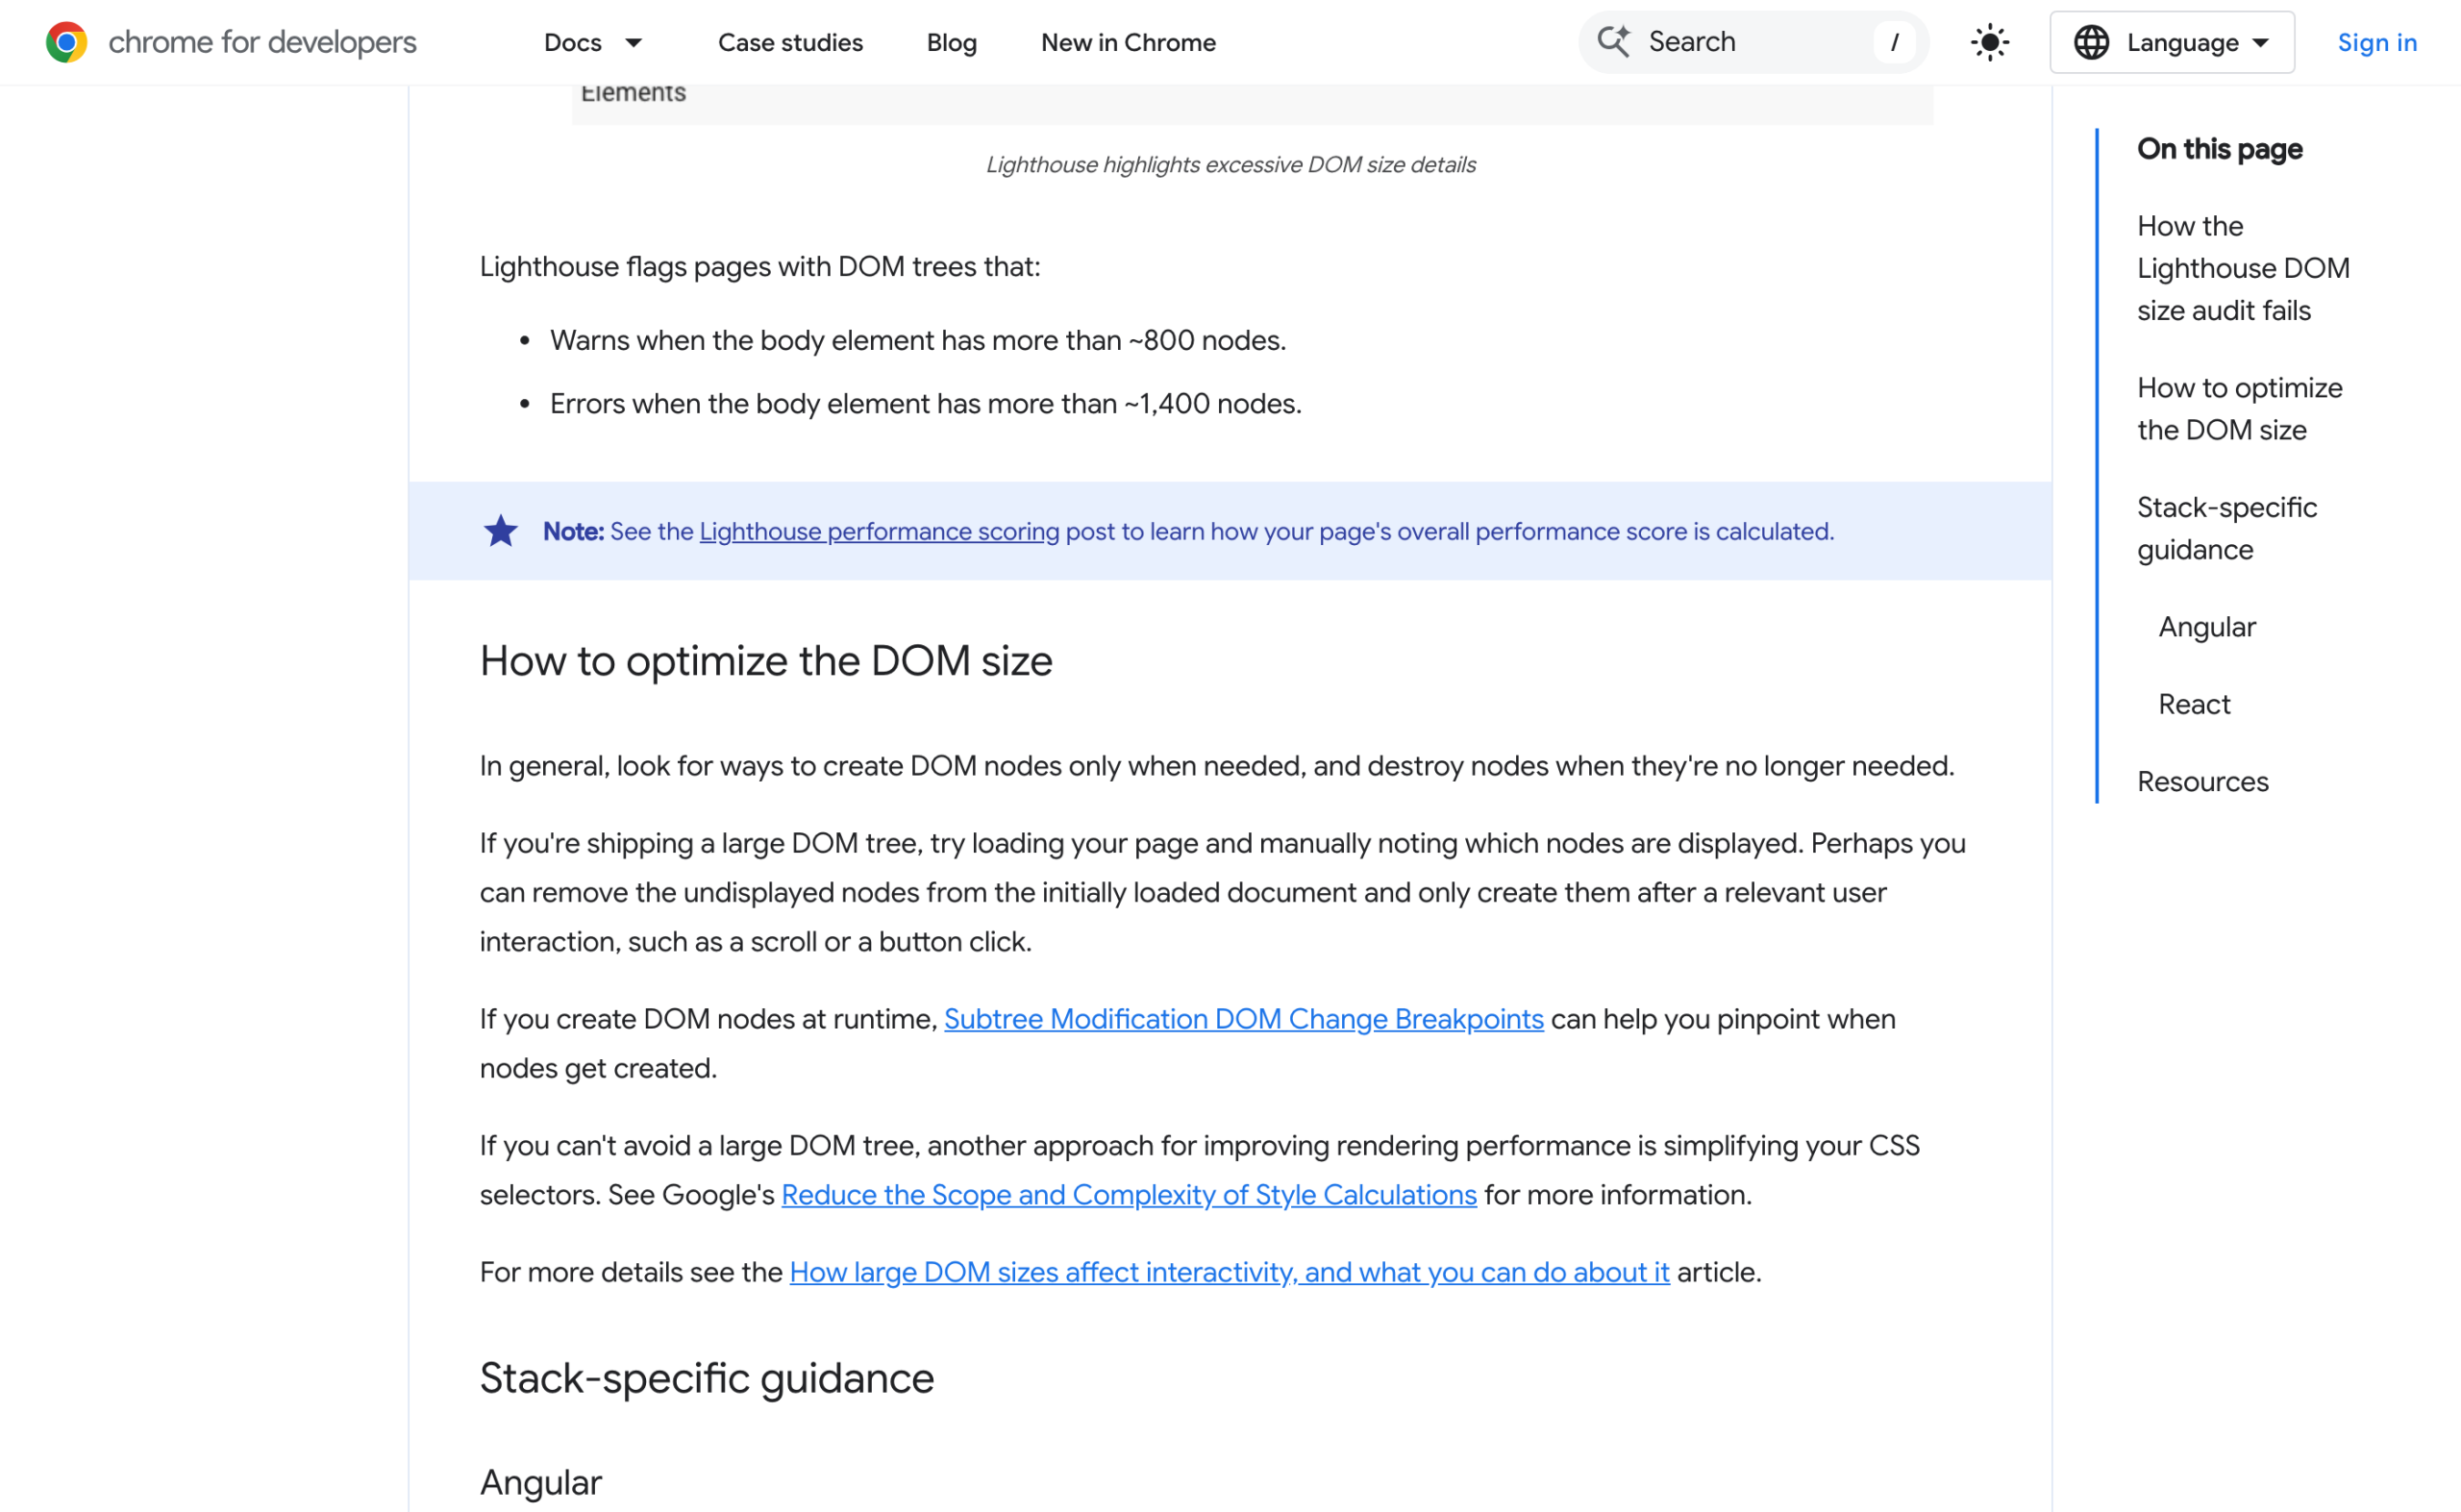
Chrome’s Lighthouse DOM size documentation, last updated 21 June 2024, says the audit warns when the body has more than about 800 nodes and errors above about 1,400.
So my own homepage sits just over the warning line, at 879. Sixty percent of that tree is div elements produced by a page builder to hold layout.
Depth is the cost people miss
Depth is the cost that people miss. A deep tree makes the browser recompute style and position down the whole chain whenever anything changes, which shows up as sluggish interaction rather than slow loading.
It lands on Interaction to Next Paint, not on load time, which is why a site can score well on paint metrics and still feel bad to use.
What this does not tell you
- These are single measurements from one location. I ran each one between four and six times and reported the spread, but everything here is from one machine in India hitting a Cloudflare edge in Singapore. Your distances are different and so are your numbers.
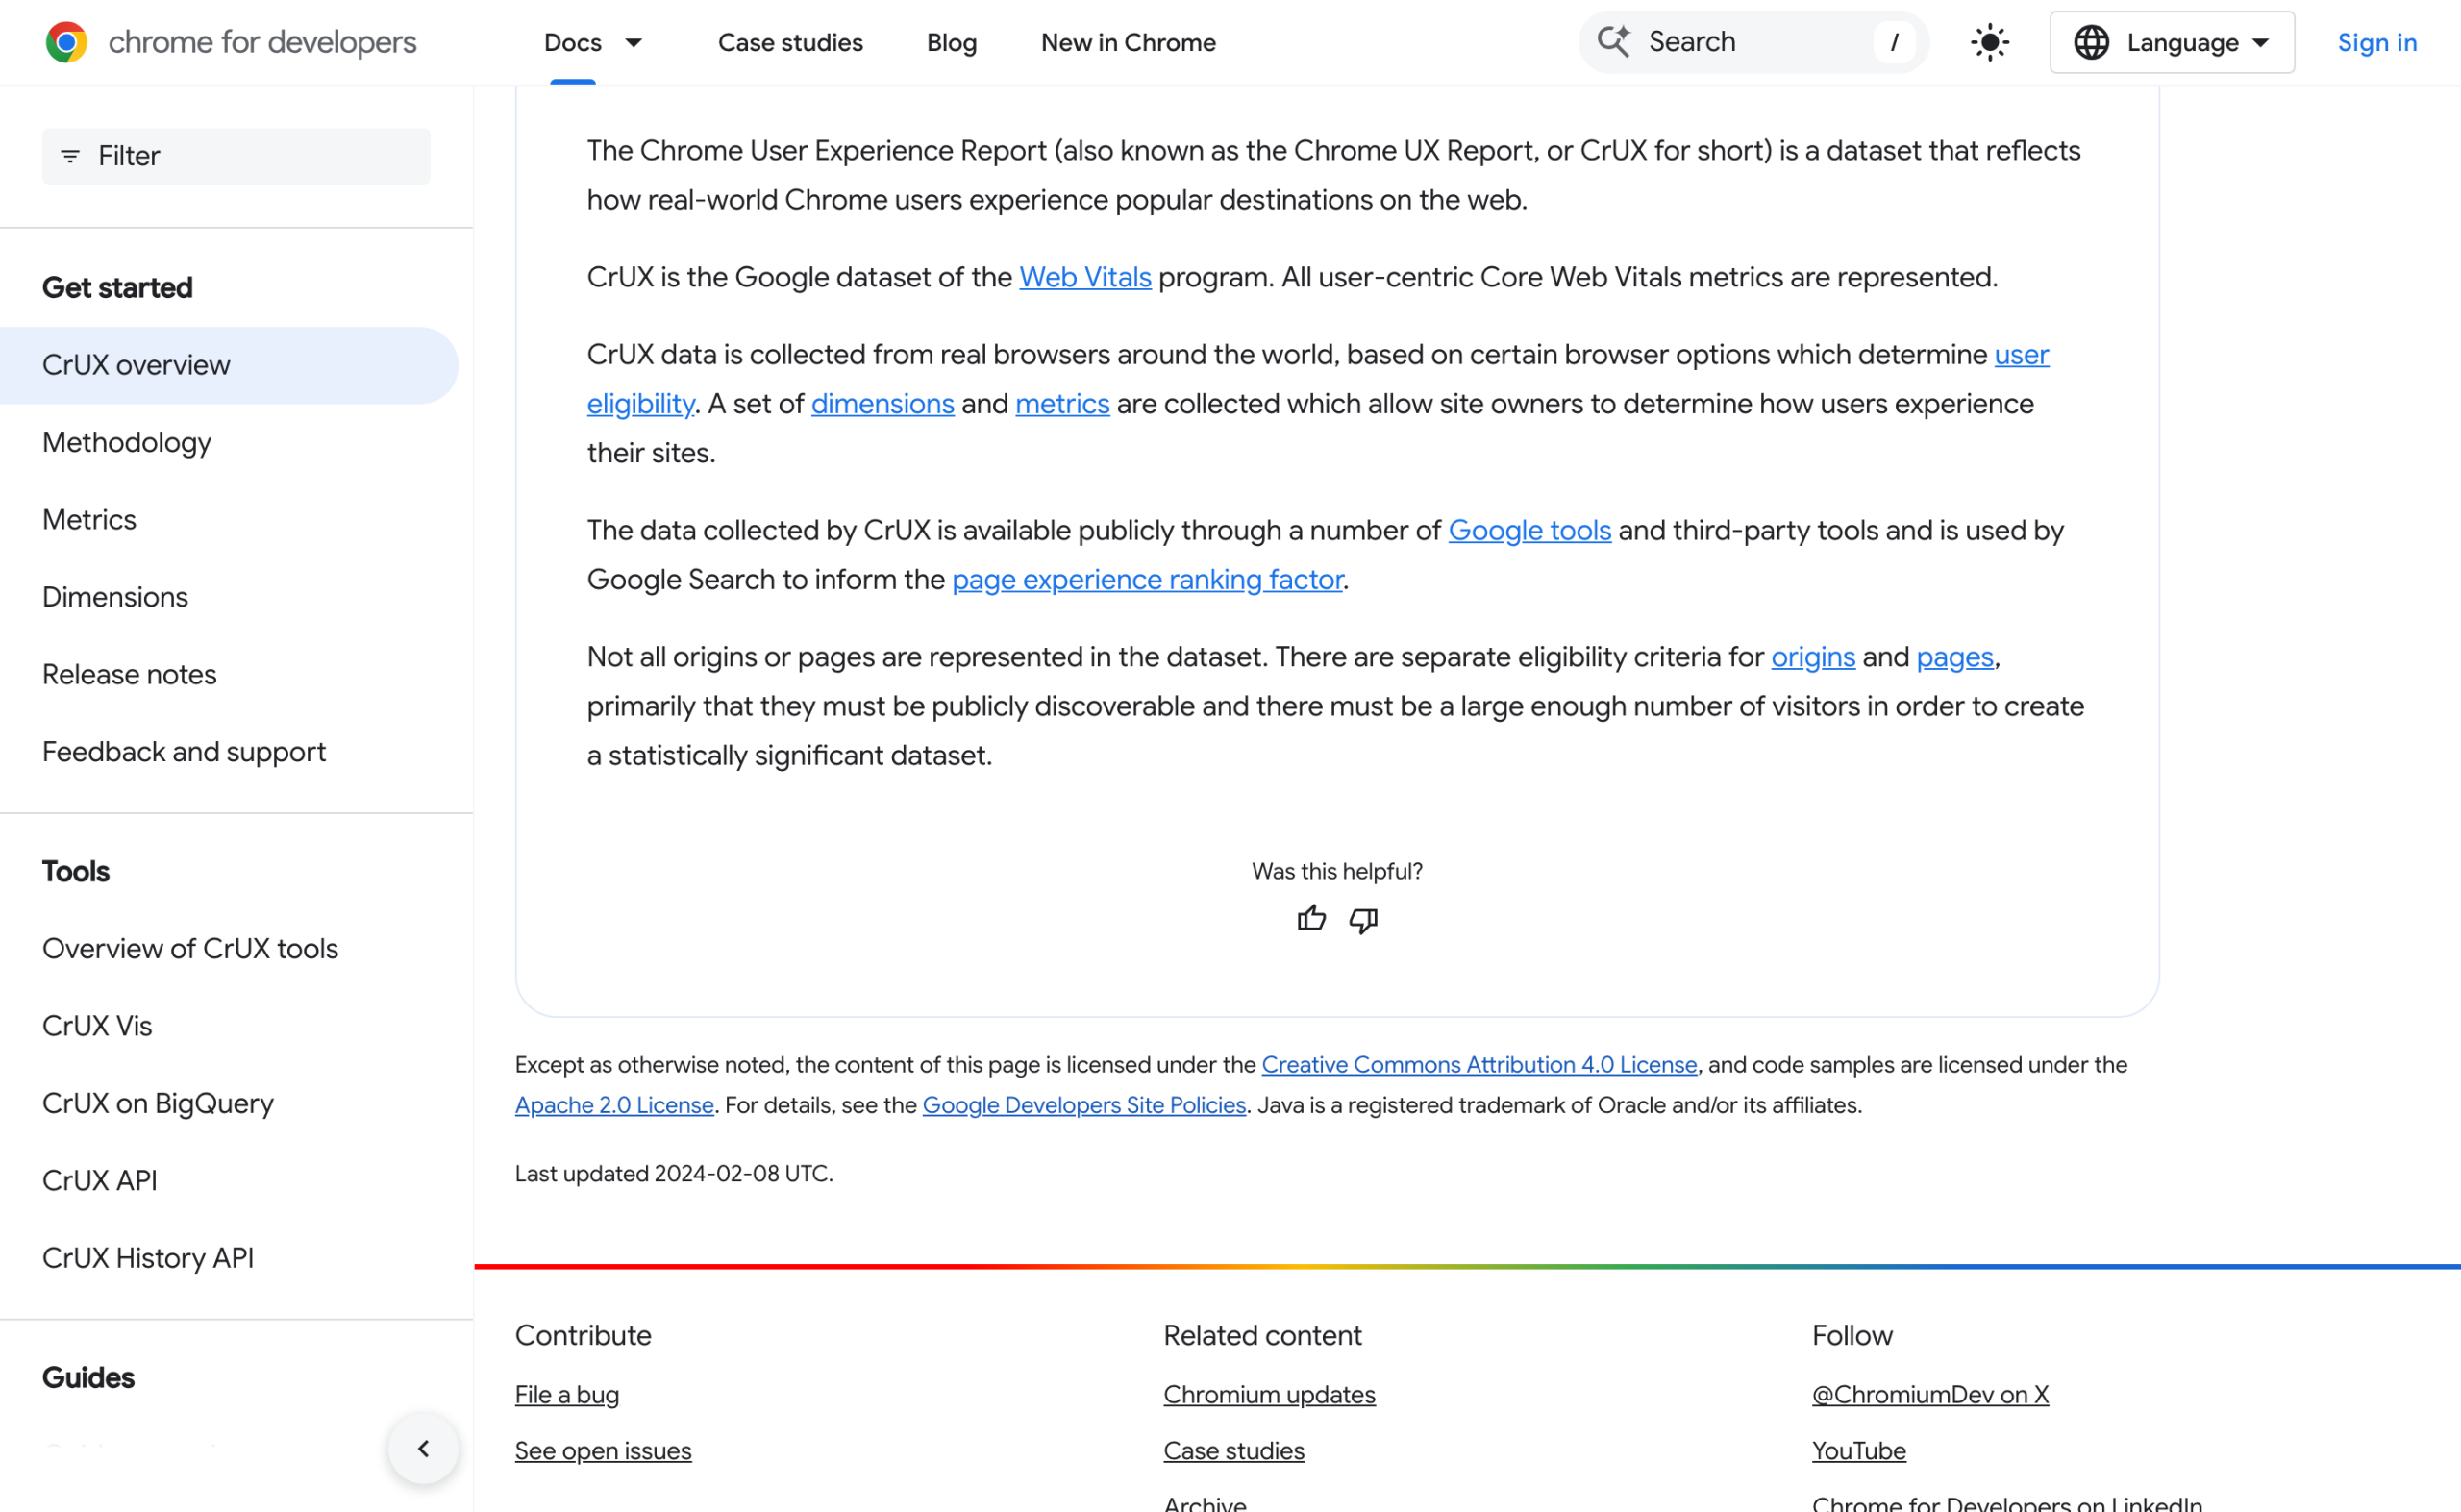
- None of this is field data. PageSpeed showed No Data under real user experience for this URL, because the site does not have enough Chrome traffic to appear in the Chrome User Experience Report. Everything above is a lab measurement or a byte count, and I have labelled it as such.
- Two of the three bugs are fixed, the big one is not. The duplicate Plausible tag and the empty stylesheet are both gone, verified on 3 September 2026. Cloudflare still returns
cf-cache-status: DYNAMICon every HTML request, so the HTML is still not edge cached and that is still the defect that costs the most.
Do this in the next ten minutes
Pick your own homepage and run these, in this order. They take under a minute and they will tell you which of the four possible problems you actually have.
# 1. Is your page cache even hitting, and how slow is a hit?
curl -s -o /dev/null -D h.txt -w 'ttfb=%{time_starttransfer}\n' https://YOURSITE/
grep -iE 'x-.*cache|cf-cache-status|age:' h.txt

# 2. Is the distance the cost? Force origin with a cache-busting query string
curl -s -o /dev/null -w 'ttfb=%{time_starttransfer}\n' \
  'https://YOURSITE/wp-includes/js/jquery/jquery.min.js?bust=1'
Then step 3, the byte count.
Save the page with curl -s https://YOURSITE/ -o p.html, count stylesheets and scripts with grep -coE '<link[^>]+rel=.stylesheet' p.html and grep -coE '<script[^>]+src=' p.html, then fetch the page once with -H 'Accept-Encoding: gzip' and print size_download.
If step 1 shows a cache HIT and step 2 is still slow, your problem is distance and no plugin will fix it. If step 1 shows a MISS every time, your page cache is broken and that is the first thing to repair.
If both look fine and the site still feels slow, the answer is in step 3 and in the DOM count above.
The one number I would put on a wall: on my site, the page cache was working, and the page still took a second. Check yours before you buy anything.
Related reading
- The same habit applied to malware scanning, where the tool said clean and the raw response said otherwise: the scanner said clean, the site was serving spam to Googlebot.
- Images are the other half of byte weight, and there is a free way to deal with them in bulk: how to compress WordPress images in bulk.
- Where those 27 stylesheets come from when you build with Elementor, and whether a child theme changes it: do you need a child theme with Elementor.
- If a media query is not applying, the cause is often the same stylesheet ordering that produces this file count: how to fix media query not working in WordPress.
- For running these checks on a schedule instead of by hand: running Claude Code against WordPress.
Resources
- Lighthouse DOM size audit, Chrome for Developers, last updated 21 June 2024. Source of the 800 and 1,400 node thresholds.
- Web Vitals, web.dev, last updated 31 October 2024.
- PageSpeed Insights. The run quoted here used Lighthouse 13.4.1 on an emulated Moto G Power.
- curl
--write-outvariables, for the timing fields used in every command above. - Chrome User Experience Report, the field dataset that returned No Data for this URL.