Finding the Slow Query in WordPress: EXPLAIN, the Slow Log, and What They Each Miss
On this page, 10 sections
Rows_sent: 12. Rows_examined: 138,343. That is one line out of a real slow query log I generated this morning, 3 September 2026, and it is the only diagnostic in this post you strictly need.
The query returned twelve product IDs for a shop archive page and read a hundred and thirty-eight thousand rows to do it.
# Query_time: 0.287102  Lock_time: 0.004358  Rows_sent: 12  Rows_examined: 138343
# Rows_affected: 0  Bytes_sent: 165
# Tmp_tables: 1  Tmp_disk_tables: 0  Tmp_table_sizes: 1572800
# Full_scan: Yes  Full_join: No  Tmp_table: Yes  Tmp_table_on_disk: No
# Filesort: Yes  Filesort_on_disk: No  Merge_passes: 0  Priority_queue: No
Query Monitor will tell you which plugin fired that query and how long it took.
I went through that method in the post on finding the plugin that is slowing your site, and it is the right first step.
This post starts one step later: you have the query, you know who sent it, and now you need to know why it is slow, which is a different question with a different toolset.
Set up a database you are allowed to break
Do not run EXPLAIN experiments against production. Everything below runs in a throwaway container with the real WordPress schema in it, which took under a minute to build.
Two commands. docker run -d --name wpq -e MARIADB_ROOT_PASSWORD=r -e MARIADB_DATABASE=wp mariadb:11.4, then docker exec wpq mariadb -uroot -pr -e "select version()" wp, which reported 11.4.12-MariaDB-ubu2404.
The schema is not invented. I took it verbatim from wp-admin/includes/schema.php in the WordPress 7.1 tarball, which is where core defines every table it creates.
The two tables that matter here are wp_posts and wp_postmeta, and the postmeta definition is the whole story.
The definition of $wpdb->postmeta is four columns and three keys. meta_id is the auto-increment primary key, post_id and meta_key($max_index_length) each get their own index, and meta_value is a longtext with nothing on it.
Three indexes. One on meta_id, one on post_id, and a prefix index on the first 191 characters of meta_key. There is no index on meta_value, and there is no composite index pairing a key with its value.
meta_value is a longtext, which cannot be indexed in full anyway. Every performance problem people blame on postmeta descends from those two sentences.
I seeded 50,000 posts and 133,332 meta rows, ran ANALYZE TABLE so the optimiser had current statistics, and pointed a realistic WooCommerce-shaped query at it. If you want the same environment, the WordPress in Docker walkthrough covers the general setup.
The query, and what EXPLAIN says about it
This is the shape WP_Query produces for a price-range filter. Every WooCommerce store with a price slider is running something structurally identical.
It selects wp_posts.ID with SQL_CALC_FOUND_ROWS, inner joins wp_postmeta on post_id, filters on meta_key = '_price' with CAST(wp_postmeta.meta_value AS DECIMAL(10,2)) BETWEEN 20 AND 60, restricts to published products, then groups by wp_posts.ID, orders by post_date DESC and takes LIMIT 0, 12.
Put EXPLAIN in front of it and you get two rows.
On wp_postmeta: type is ALL, possible_keys lists post_id,meta_key, key is NULL, rows is 134,370 and Extra reads Using where; Using temporary; Using filesort. On wp_posts: eq_ref on PRIMARY, one row.
How to read that, column by column
type, the access method
type is the first thing to look at and the last thing anyone reads. It is the access method, and it runs from best to worst roughly like this: const, eq_ref, ref, range, index, ALL.
Anything at ALL on a table with more than a few thousand rows is a full table scan. Anything at index is a full scan of the index, which is smaller but still a scan.
possible_keys against key
possible_keys against key is the diagnostic pair. Here possible_keys lists post_id and meta_key, so the optimiser saw two usable indexes. key is NULL, so it used neither.
That gap, indexes available and none chosen, is the signature of a predicate the index cannot answer.
rows is an estimate, not a count
rows is an estimate of how many rows the engine expects to read from that table, not how many it will return.
134,370 estimated against 133,332 actual is a well-calibrated statistic, which tells me ANALYZE TABLE did its job and the plan is not the result of stale statistics.
That is worth checking before you conclude anything: a bad plan from stale statistics looks identical to a bad plan from a bad query.
Extra is where the cost hides
Extra is where the real cost hides. Using temporary means the result is being materialised into a temporary table, here because of the GROUP BY on a column from a different table than the sort.
Using filesort means the sort could not be satisfied by an index and has to be done by hand. Using where is benign and appears almost everywhere.
What is missing from Extra
What is not in Extra matters too. Using index means a covering index: everything the query needs is in the index and the table itself is never touched.
It is the best line you can see in an EXPLAIN output and it is why adding a column to an existing index sometimes makes a query ten times faster with no other change.
EXPLAIN estimates. ANALYZE measures.
EXPLAIN is the optimiser telling you its plan. It does not run the query. MariaDB’s ANALYZE FORMAT=JSON runs it and reports actual counts alongside the estimates, which is where the query stops being theoretical.
The JSON reports r_total_time_ms of 772.96 for the statement. On wp_postmeta it gives access_type ALL, rows 134,370 against r_rows 133,332, filtered 23.98 against r_filtered 1.269, and r_table_time_ms of 235.66. The attached condition is the meta_key match plus the cast.
filtered against r_filtered
filtered against r_filtered is the number to stare at. The optimiser expected the WHERE clause to keep about 24% of the rows it read.
It actually kept 1.27%. That gap is why the plan is bad: the optimiser priced a full scan as reasonable because it thought a quarter of the table would survive, and in reality it threw away ninety-nine rows in every hundred it read.
On MySQL 8.0.18 and later the equivalent is EXPLAIN ANALYZE, which gives actual time and row counts in a tree format. Different syntax, same job.
Use whichever your server has, and always look at the actual numbers rather than the estimates when the two disagree.
The finding: the index was never the problem
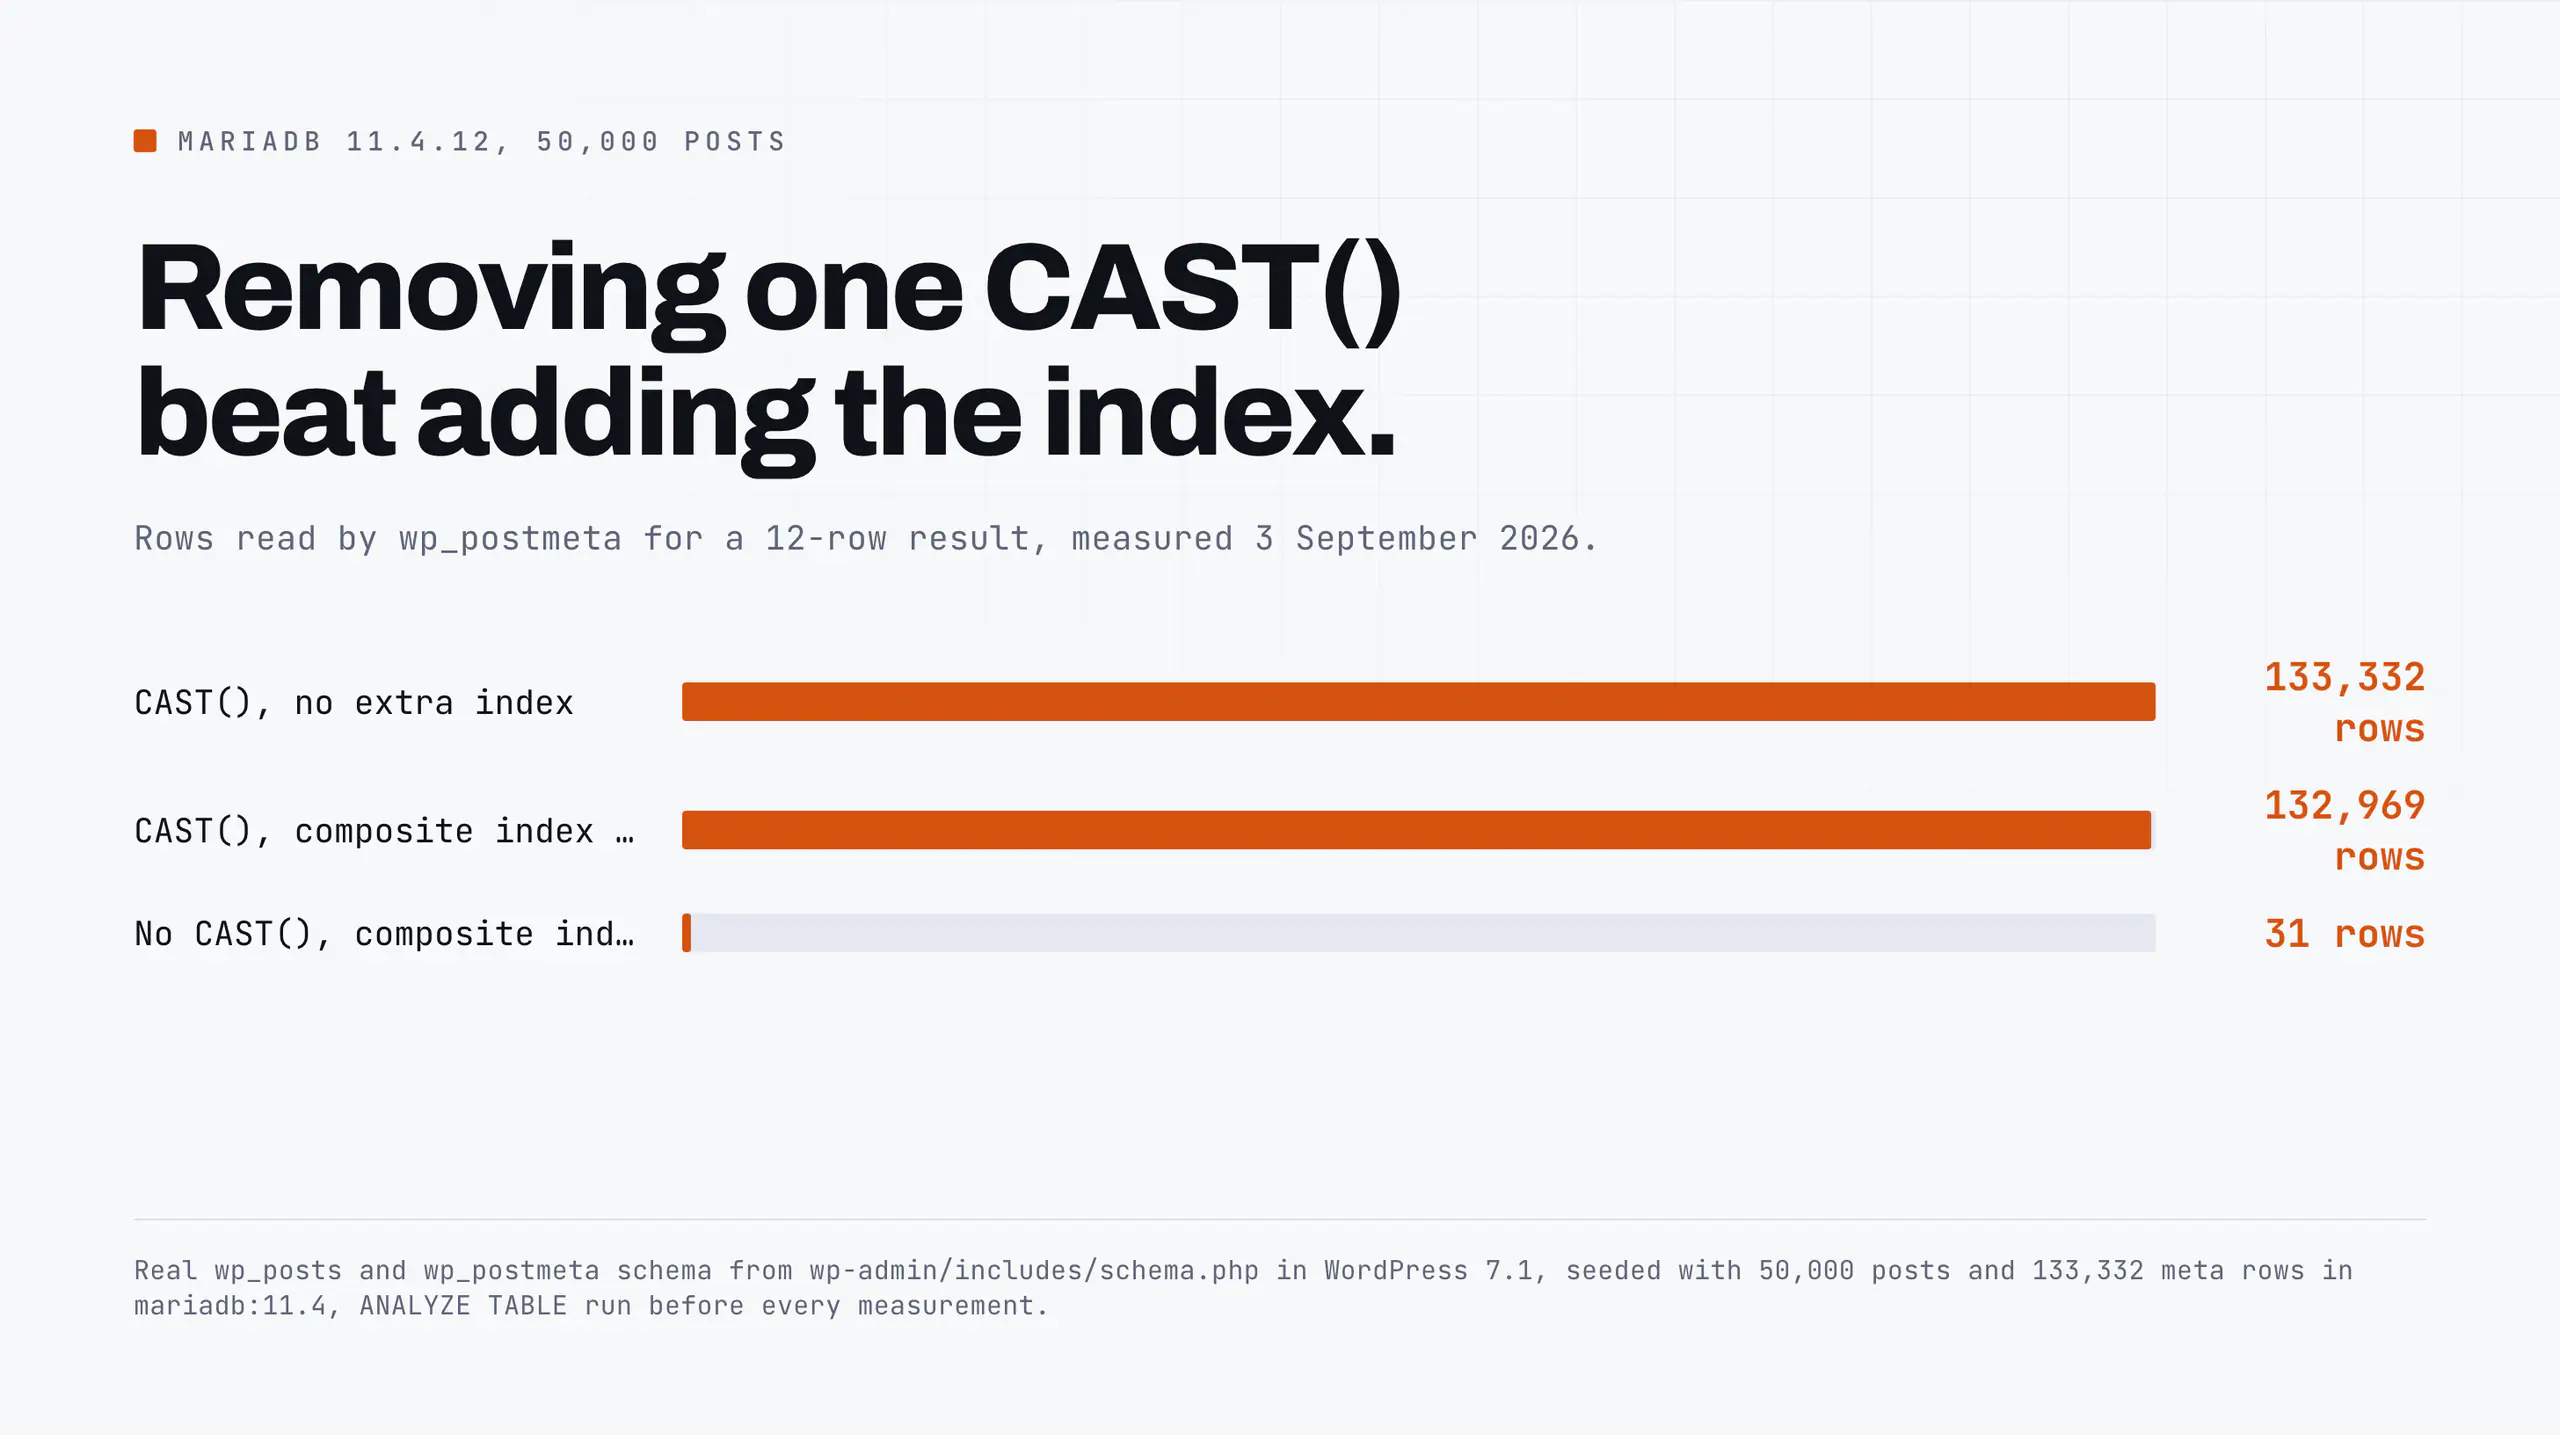
The obvious fix is a composite index on key and value. I added one.
That is ALTER TABLE wp_postmeta ADD KEY meta_key_value (meta_key(32), meta_value(12)); followed by ANALYZE TABLE wp_postmeta;.
Then re-ran the same EXPLAIN.
The plan comes back unchanged except for one column. possible_keys now reads post_id,meta_key,meta_key_value. key is still NULL, type is still ALL, and rows is 132,969.
The new index appears in possible_keys. key is still NULL. Still a full scan. Adding the index changed nothing, because the problem was never a missing index.
The cast is what kills the index
The problem is CAST(wp_postmeta.meta_value AS DECIMAL(10,2)). An index stores the column’s values in the column’s own order. The moment you wrap the column in a function, the engine can no longer use that order, because the function’s output order is unknown to the index.
The predicate stops being sargable, which is the ugly old word for able to be answered by an index search. This applies to CAST(), to LOWER(), to DATE(), to SUBSTRING(), and to arithmetic on the column.
It does not apply when the function is on the other side of the comparison.
The proof is one substitution. Same query, same index, comparing the column directly instead of through a cast.
With wp_postmeta.meta_value = '42' in place of the cast, type becomes ref, key becomes meta_key_value with a key_len of 182 and a ref of const,const, and rows drops to 31.
ALL became ref. 132,969 rows became 31. Timed three times each on the same warm database:
with CAST:     1.2157s   0.5527s   0.3757s
without CAST:  0.0089s   0.0055s   0.0029s
Roughly a hundred times faster, from removing a function, not from adding an index.
This is the general lesson and it is worth more than the specific case: when key is NULL but possible_keys is populated, look at what you did to the column before you look at what index is missing.
The honest caveat
The honest caveat, because this is a real tradeoff and not a trick: string comparison on meta_value gives different results from numeric comparison. ‘9’ sorts after ‘100’ as text.
The correct fix for a price range is not to remove the cast and pretend, it is to stop storing prices in longtext at all, which is why WooCommerce added its own product lookup tables with a proper DECIMAL column.
I went through what that table set actually buys you in the WooCommerce query measurements.
The cost EXPLAIN will not show you at all
SQL_CALC_FOUND_ROWS is added by WP_Query whenever there is a LIMIT and no_found_rows is not set, so pagination can report a total. Compare two versions of a simple archive query.
Both statements produce the same plan: type ref, key type_status_date, 47,977 rows, Extra of Using where; Using index.
The only difference between the two is the SQL_CALC_FOUND_ROWS keyword after SELECT.
Byte for byte the same plan. Using index, covering index, looks perfect. Now the actual times, three runs each:
without SQL_CALC_FOUND_ROWS:  0.0056s   0.00032s   0.00029s
with SQL_CALC_FOUND_ROWS:     0.0201s   0.01454s   0.01423s
Fifty times slower, identical plan
Fifty times slower with an identical query plan. The LIMIT 10 is honoured for what comes back and ignored for what gets counted, so the engine walks all 47,977 matching index entries to produce a number that a great many templates never print.
EXPLAIN cannot show you this because the plan genuinely is the same. Only the clock knows.
The fix is one query var, on any loop that does not paginate.
Pass 'no_found_rows' => true in the WP_Query arguments, alongside post_type and posts_per_page. That one key drops SQL_CALC_FOUND_ROWS from the generated SQL.
Core reads it in WP_Query::parse_query_vars() and the flag is checked at the point the SQL is assembled: if ( ! $query_vars['no_found_rows'] && ! empty( $limits ) ) { $found_rows = 'SQL_CALC_FOUND_ROWS'; }.
Related-posts widgets, sliders, footer lists and REST responses that do not paginate should all carry it.
Turning the slow query log on, without a restart
You do not need to edit a config file or bounce MySQL. All of these are dynamic globals:
SET GLOBAL slow_query_log = ON;SET GLOBAL long_query_time = 0.1;SET GLOBAL slow_query_log_file = '/var/log/mysql/slow.log';SET GLOBAL log_slow_verbosity = 'query_plan,explain';, MariaDB only, and the one that puts the plan into the log entry itself.SET GLOBAL log_queries_not_using_indexes = ON;, noisy, worth an hour, catches scans that sit below the time threshold.
The defaults, and why they hide everything
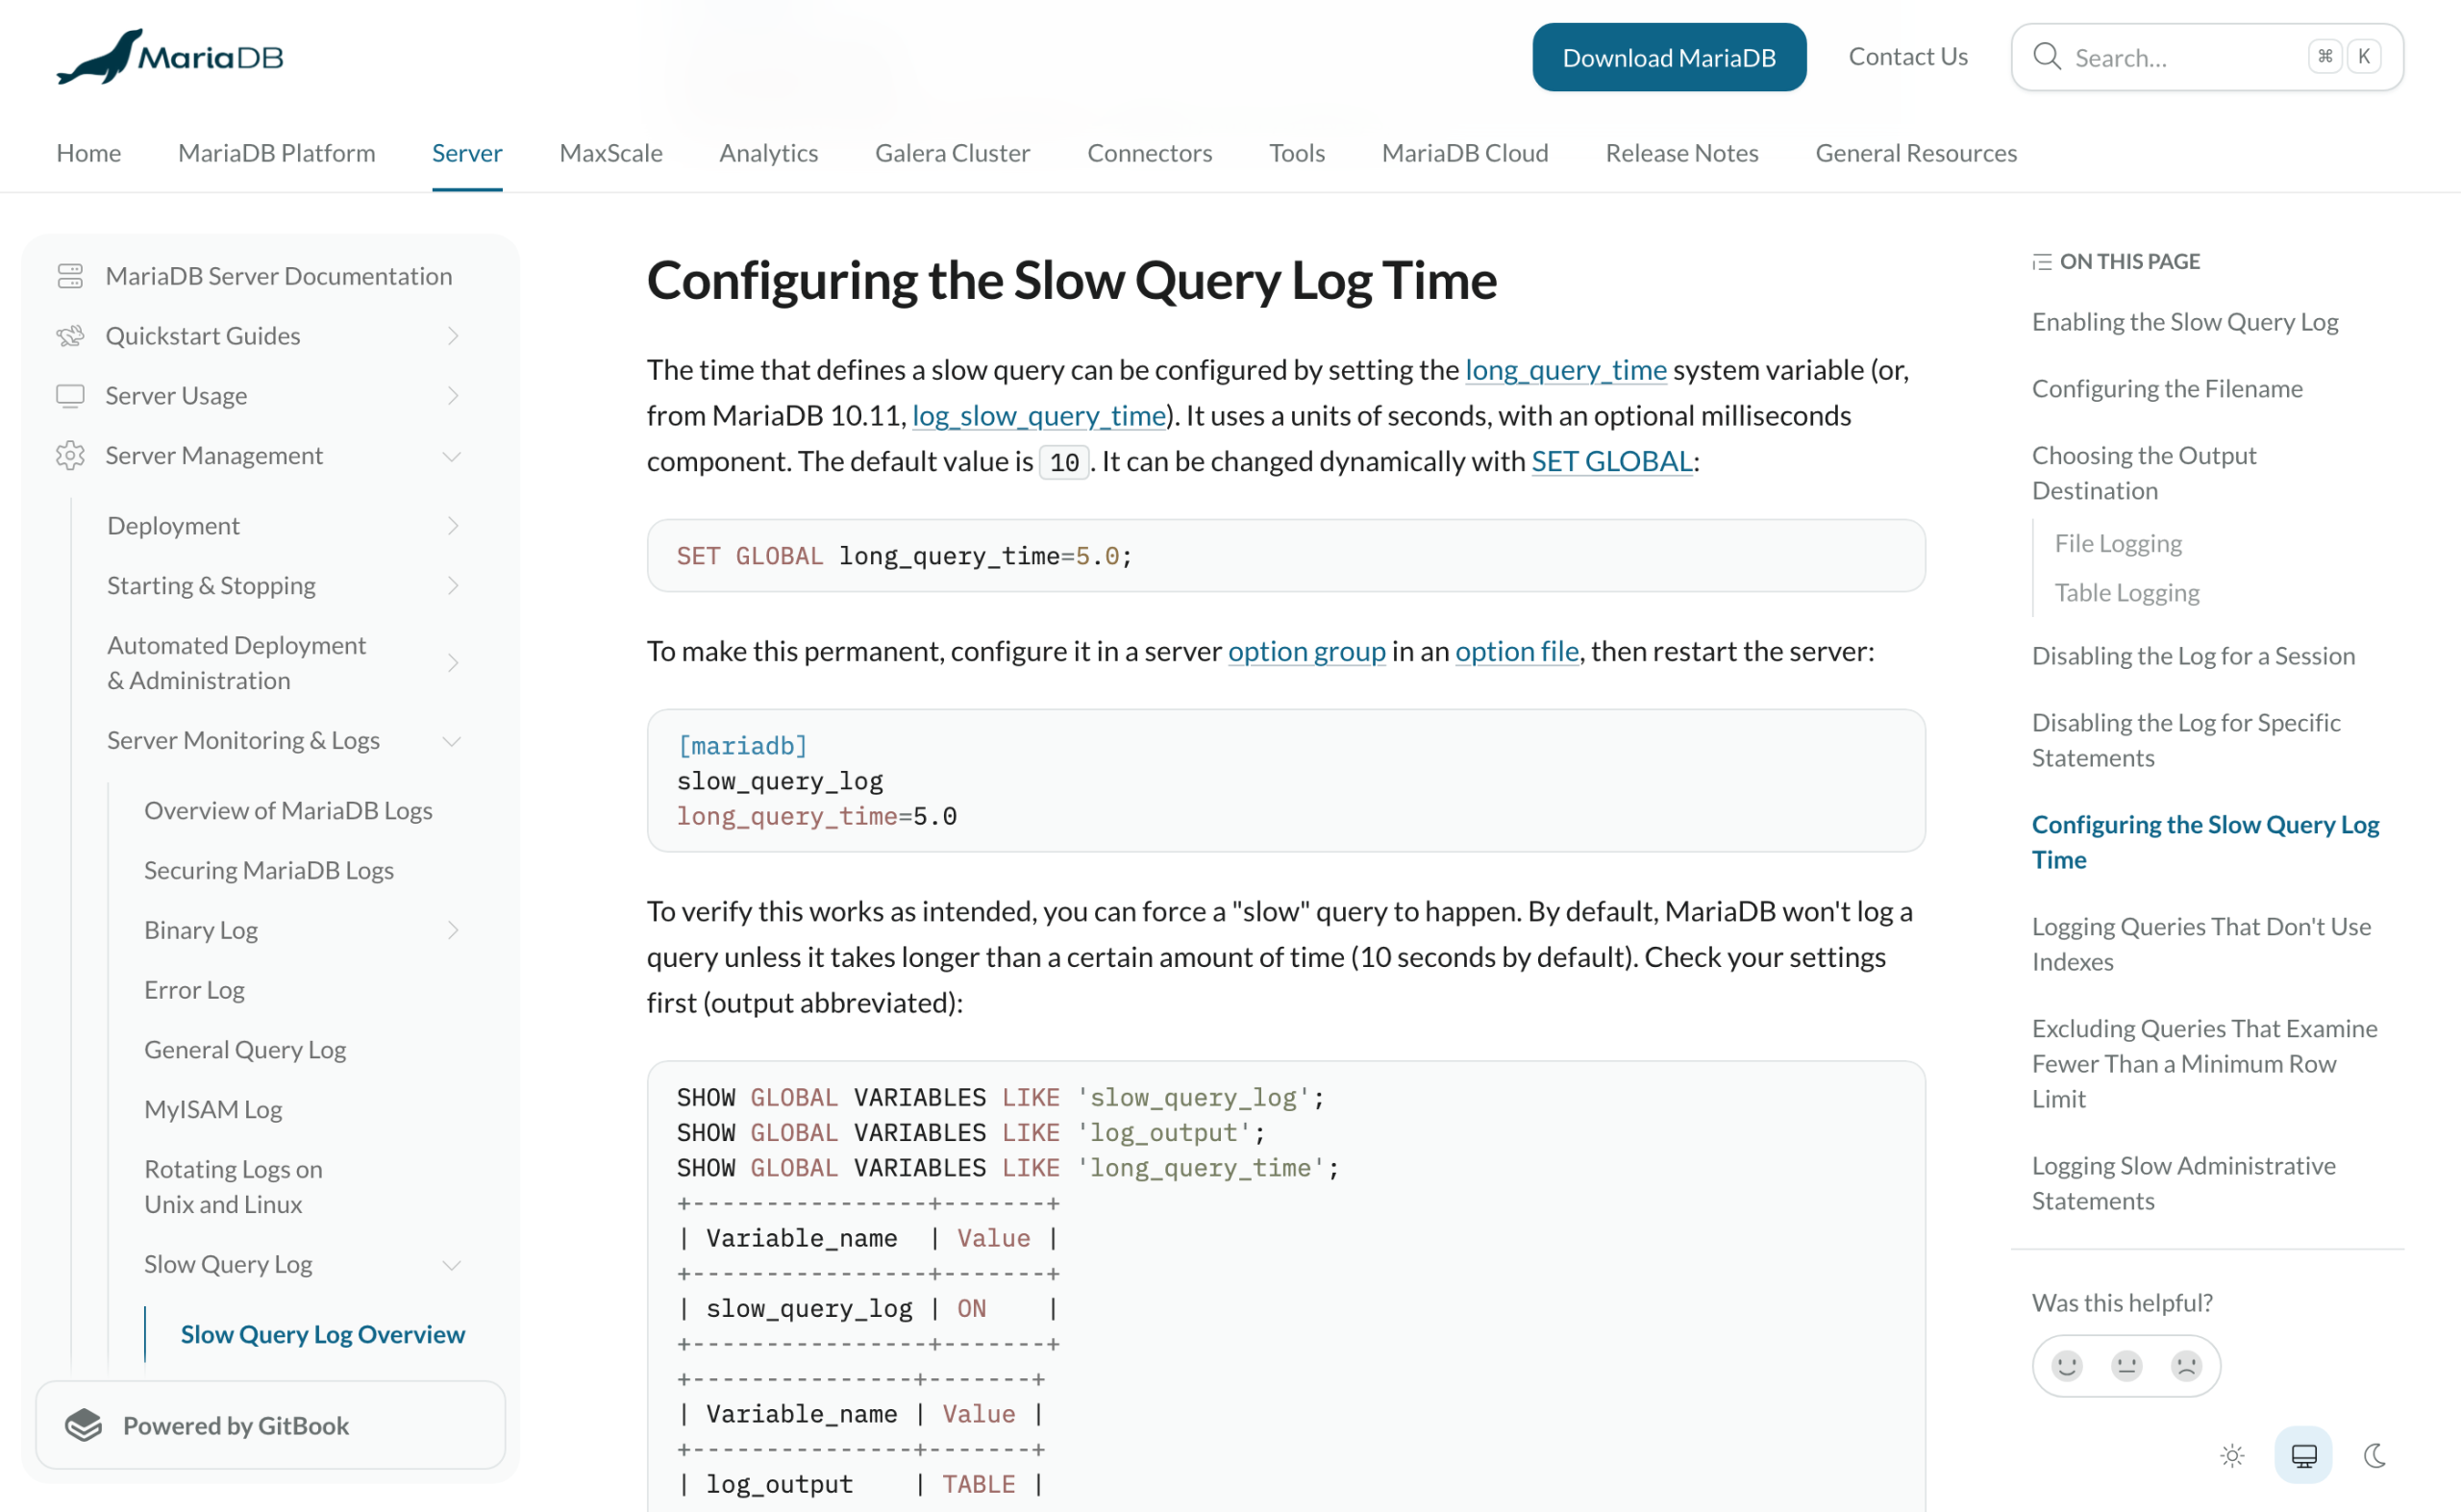
The defaults on a fresh server are slow_query_log OFF and long_query_time 10.000000. I checked on the container. Ten seconds is a threshold for catching a database that has already fallen over, not one that is degrading.
Set it to 0.1 for a day, read what comes out, then put it back.
log_slow_verbosity = 'query_plan,explain' is the setting that makes MariaDB’s log genuinely better than MySQL’s, because it embeds the EXPLAIN output in the log entry.
That is what produced the block at the top of this post, and it means you do not have to reconstruct the query’s context by hand hours later.
Each entry then carries its own explain: lines with the same columns you would get from running ANALYZE by hand. On the query above they read ALL, key NULL, 132,969 estimated against 133,332 actual rows, and filtered 24.24 against r_filtered 1.27.
The ratio to sort by is Rows_examined divided by Rows_sent. Not query time.
A query that takes 300ms once a day is not your problem; a query that reads eleven thousand rows for every row it returns will be your problem the moment traffic doubles.
In the entry above the ratio is 138,343 to 12.
SAVEQUERIES, and its one trap
The slow query log tells you what the database saw. It cannot tell you which PHP function sent it. That is what SAVEQUERIES is for, in wp-config.php.
That is define( 'SAVEQUERIES', true ); in wp-config.php.
With it defined and truthy, wpdb::log_query() appends a row to $wpdb->queries for every query, and the shape of that row is fixed in wp-includes/class-wpdb.php.
Each row in $wpdb->queries has five indexes.
0, the SQL.1,$query_timein seconds, as a float.2,$query_callstack, a comma-separated list of calling functions.3,$query_start, a unix timestamp.4,$query_data, custom data, filterable throughlog_query_custom_data.
Index 2 is the reason to use it. It is the call stack, and it names the plugin. A crude but effective dump in a mu-plugin.
Hook shutdown. Bail unless SAVEQUERIES is defined and truthy and the current user can manage_options.
Filter $wpdb->queries to the entries where index 1 is over 0.05 seconds, sort those descending, and error_log() the top ten with the time, the first 300 characters of the SQL, and the call stack from index 2.
The trap in SAVEQUERIES
The trap: SAVEQUERIES holds every query and its call stack in memory for the whole request. On a page firing two thousand queries that is a measurable memory cost and it slows the request you are measuring.
Turn it on to find something, turn it off the same day, and never leave it defined on a production site. The same discipline applies to the slow query log threshold.
Do this next
Set long_query_time to 0.1 on your database for twenty-four hours with log_slow_verbosity including explain if you are on MariaDB.
Tomorrow, sort the entries by Rows_examined over Rows_sent rather than by Query_time, take the worst one, and check whether its key column is NULL while possible_keys has entries.
If it does, look for a function wrapped around a column in the WHERE clause before you write a single ALTER TABLE.
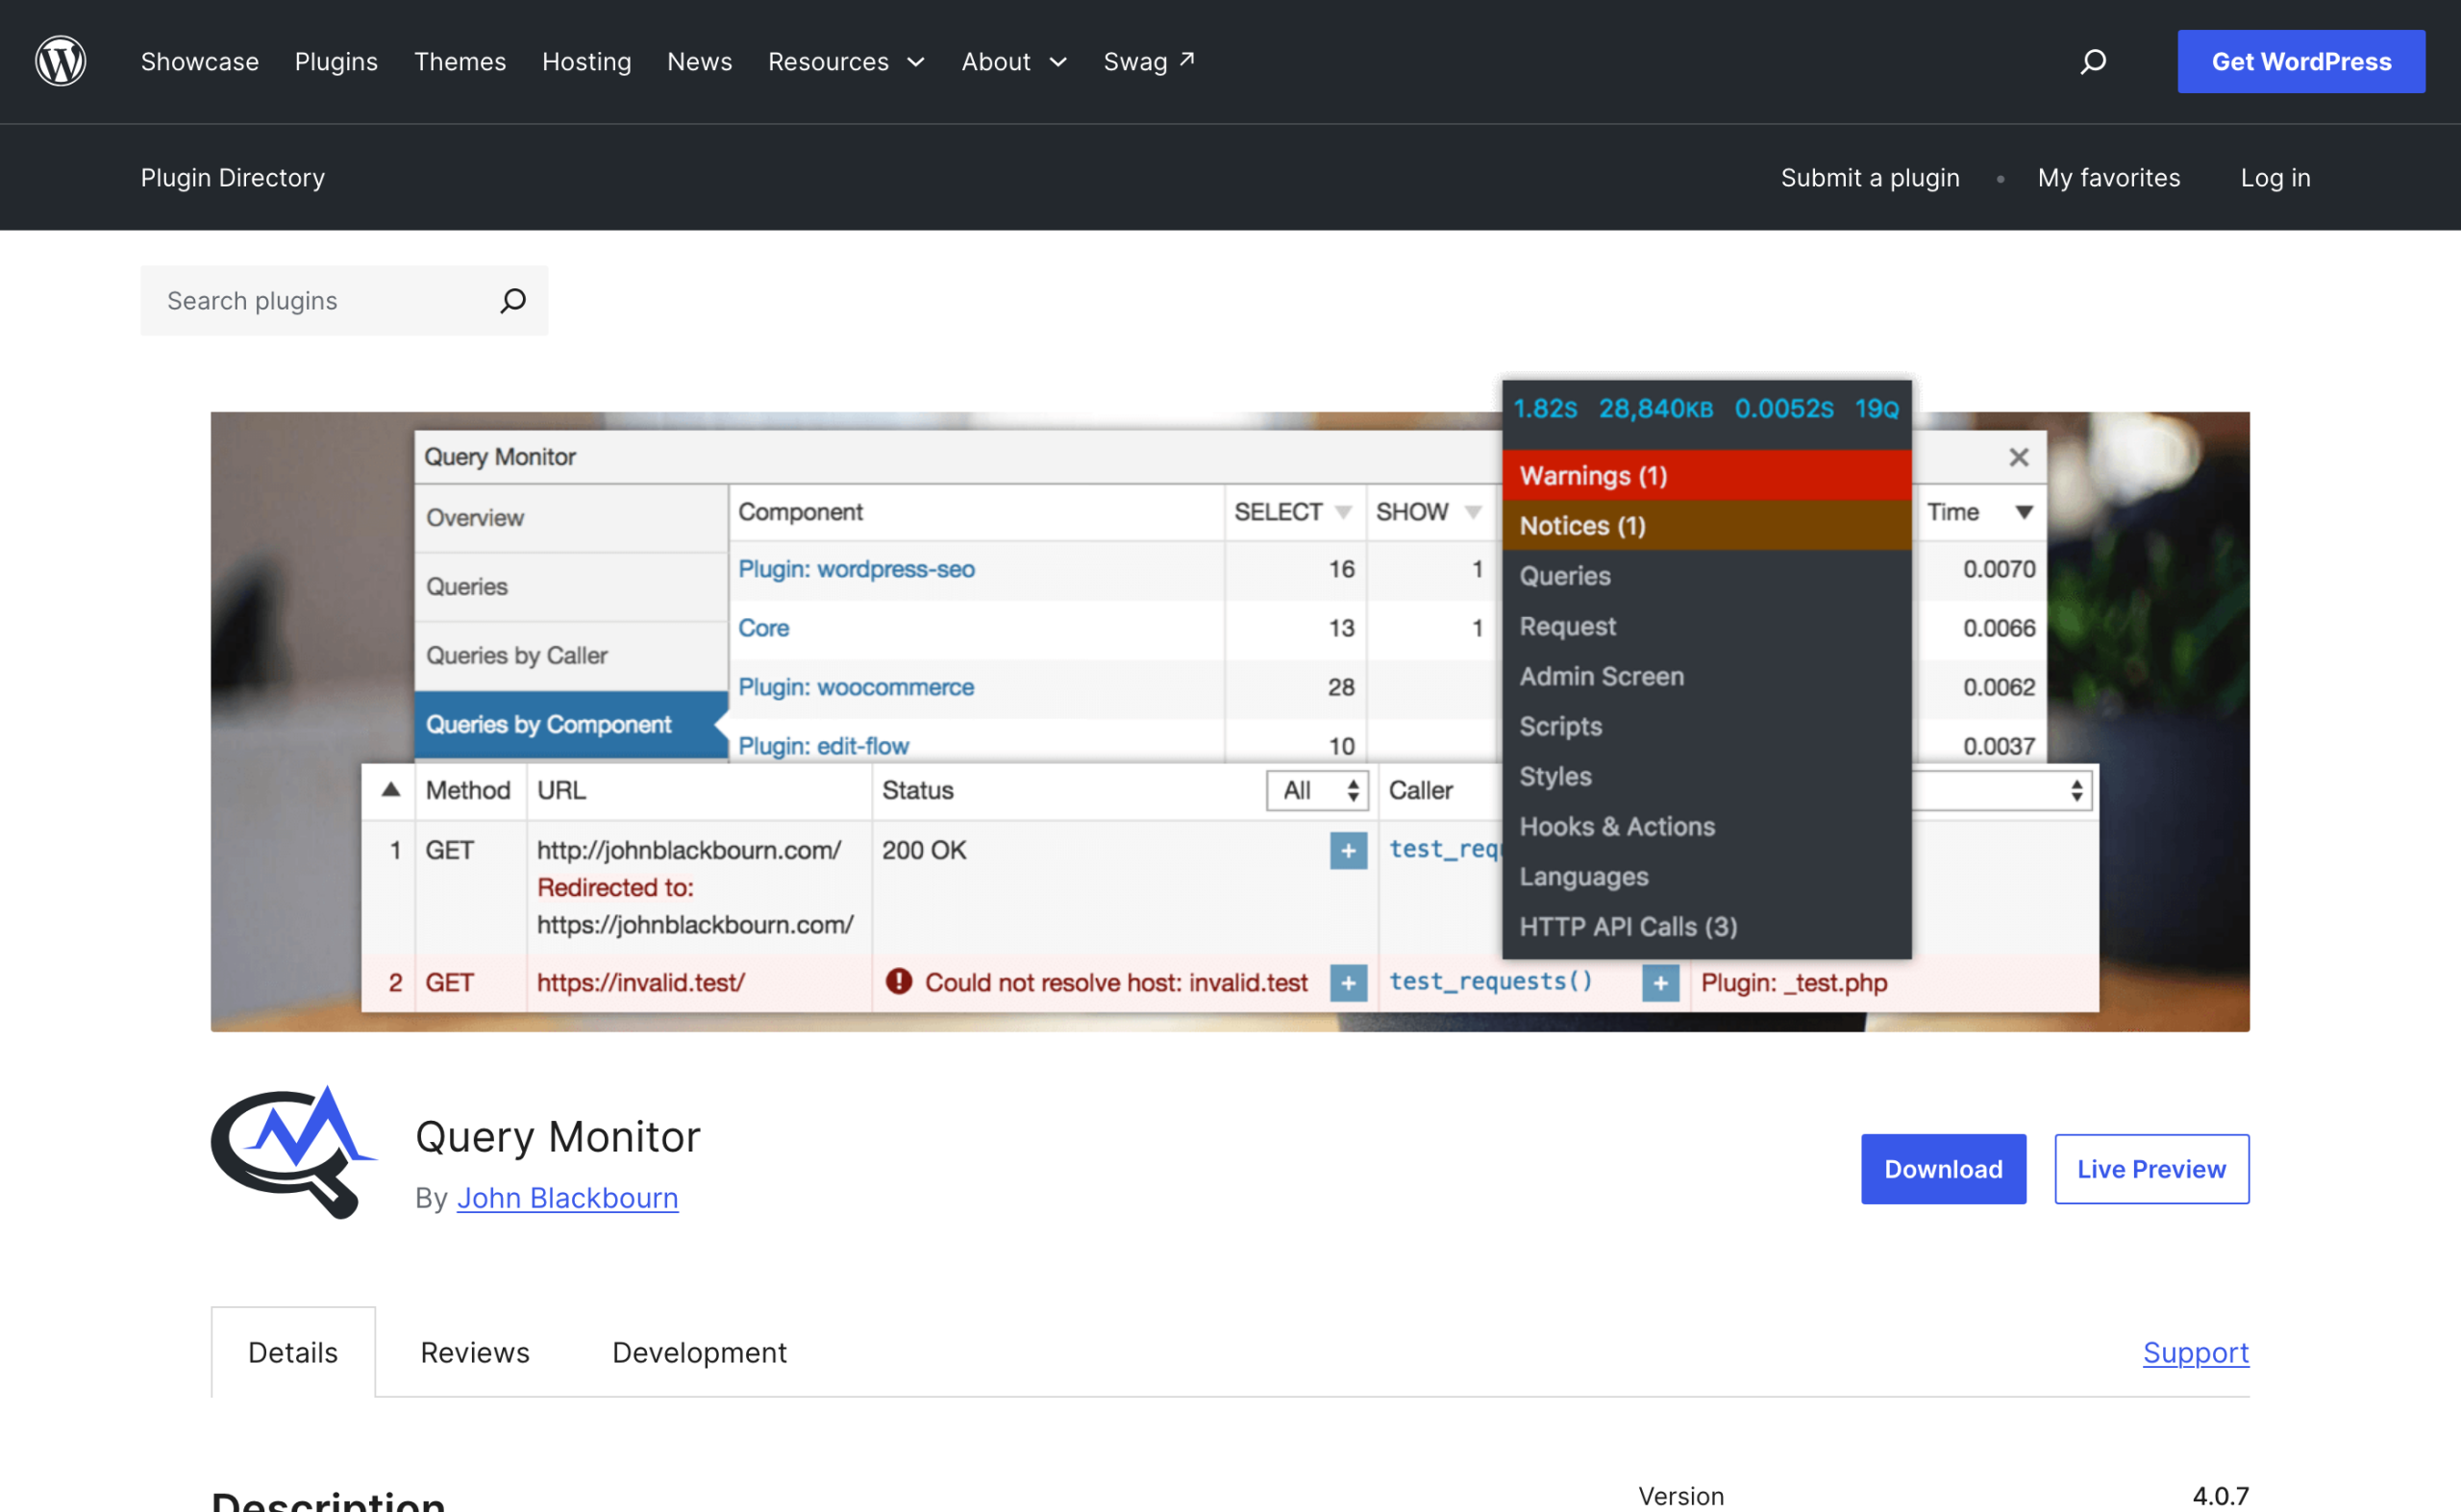
If you have not yet worked out which plugin is responsible, start with the attribution method using Query Monitor and come back here.
And if the database turns out to be innocent, the measurements on my own site and the caching layer isolation method cover where the time usually actually goes.
Resources
- MariaDB: EXPLAIN, including the meaning of every value in the type and Extra columns.
- MariaDB: ANALYZE statement, which runs the query and reports r_rows and r_filtered next to the estimates.
- MariaDB: slow query log overview, including log_slow_verbosity and the query_plan and explain options.
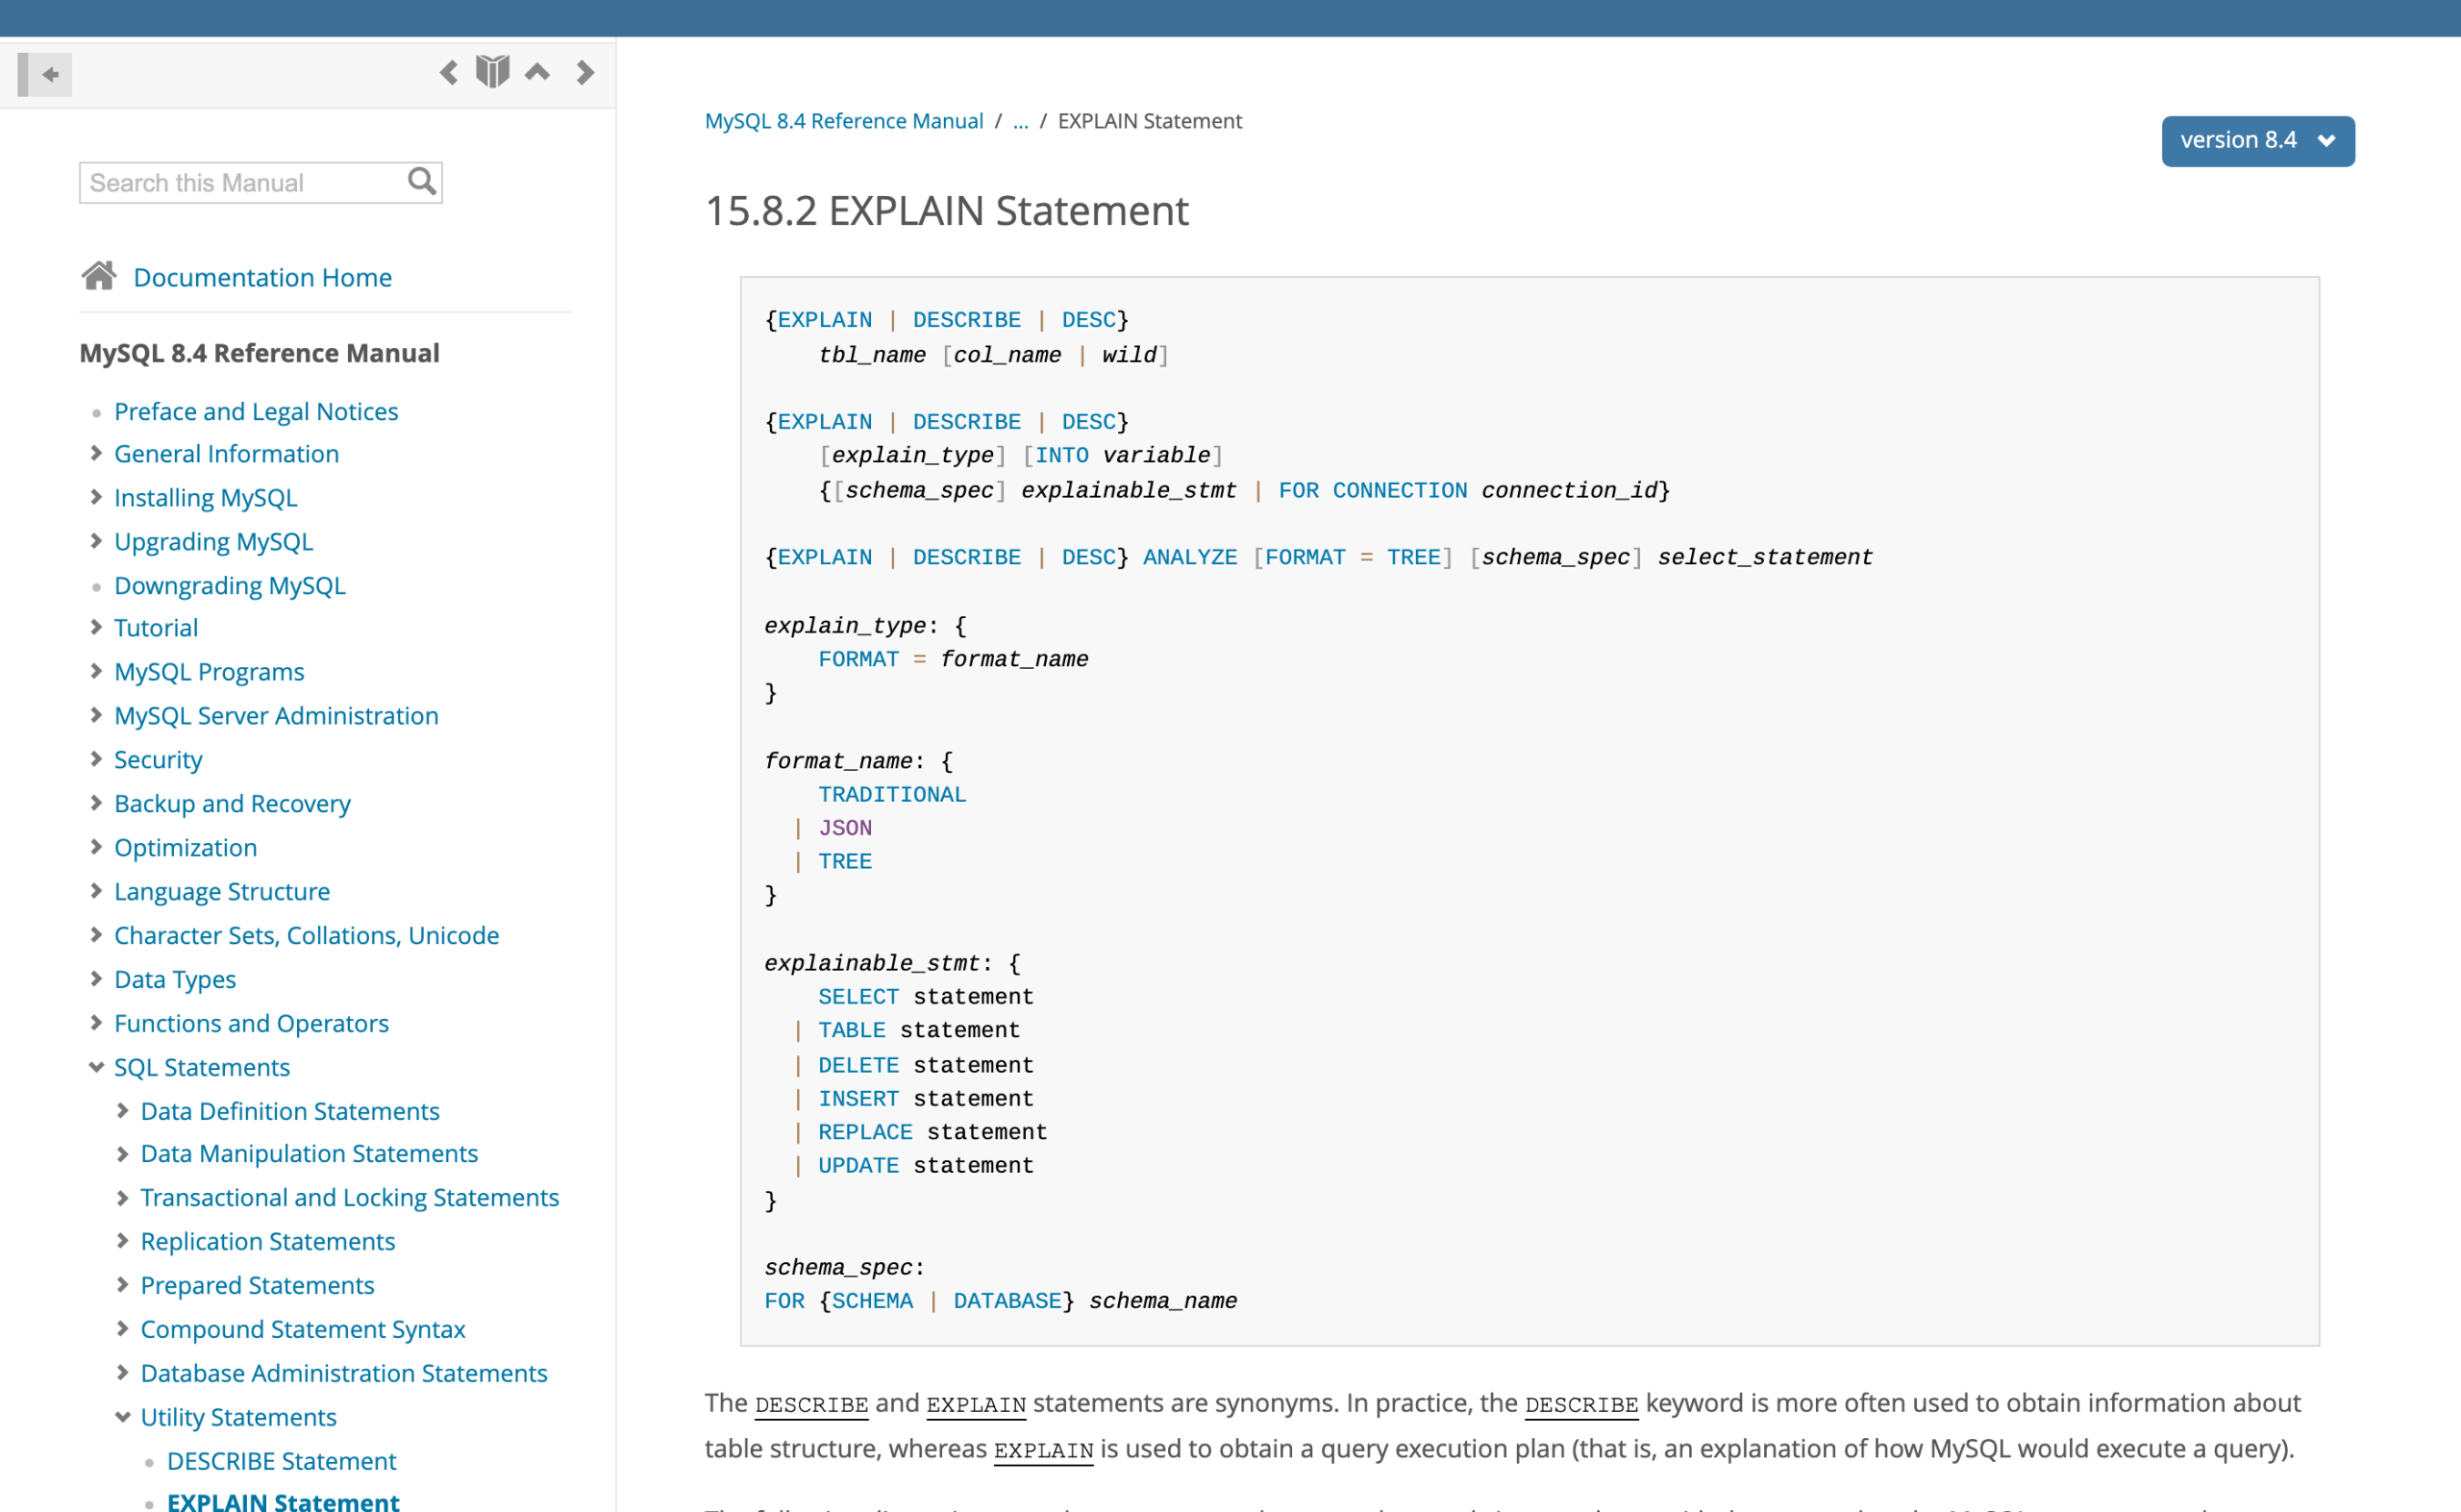
- MySQL 8.4 reference: EXPLAIN and EXPLAIN ANALYZE for the MySQL equivalents.
- wpdb in the WordPress code reference, where the queries property and log_query() are documented.
- Query Monitor on wordpress.org, for the attribution half of the job.