Elementor Performance: What Actually Costs You, Measured
On this page, 9 sections
Elementor 4.2.4 ships a front-end stylesheet of 54,666 bytes and a front-end script of 32,098 bytes. Gzipped, that is 7,269 and 10,437.
On the same page, WordPress 7.1 ships a block stylesheet of 140,761 bytes, 19,113 gzipped, whether or not you used a single block. Byte sizes read from content-length on the published files, 2 September 2026.
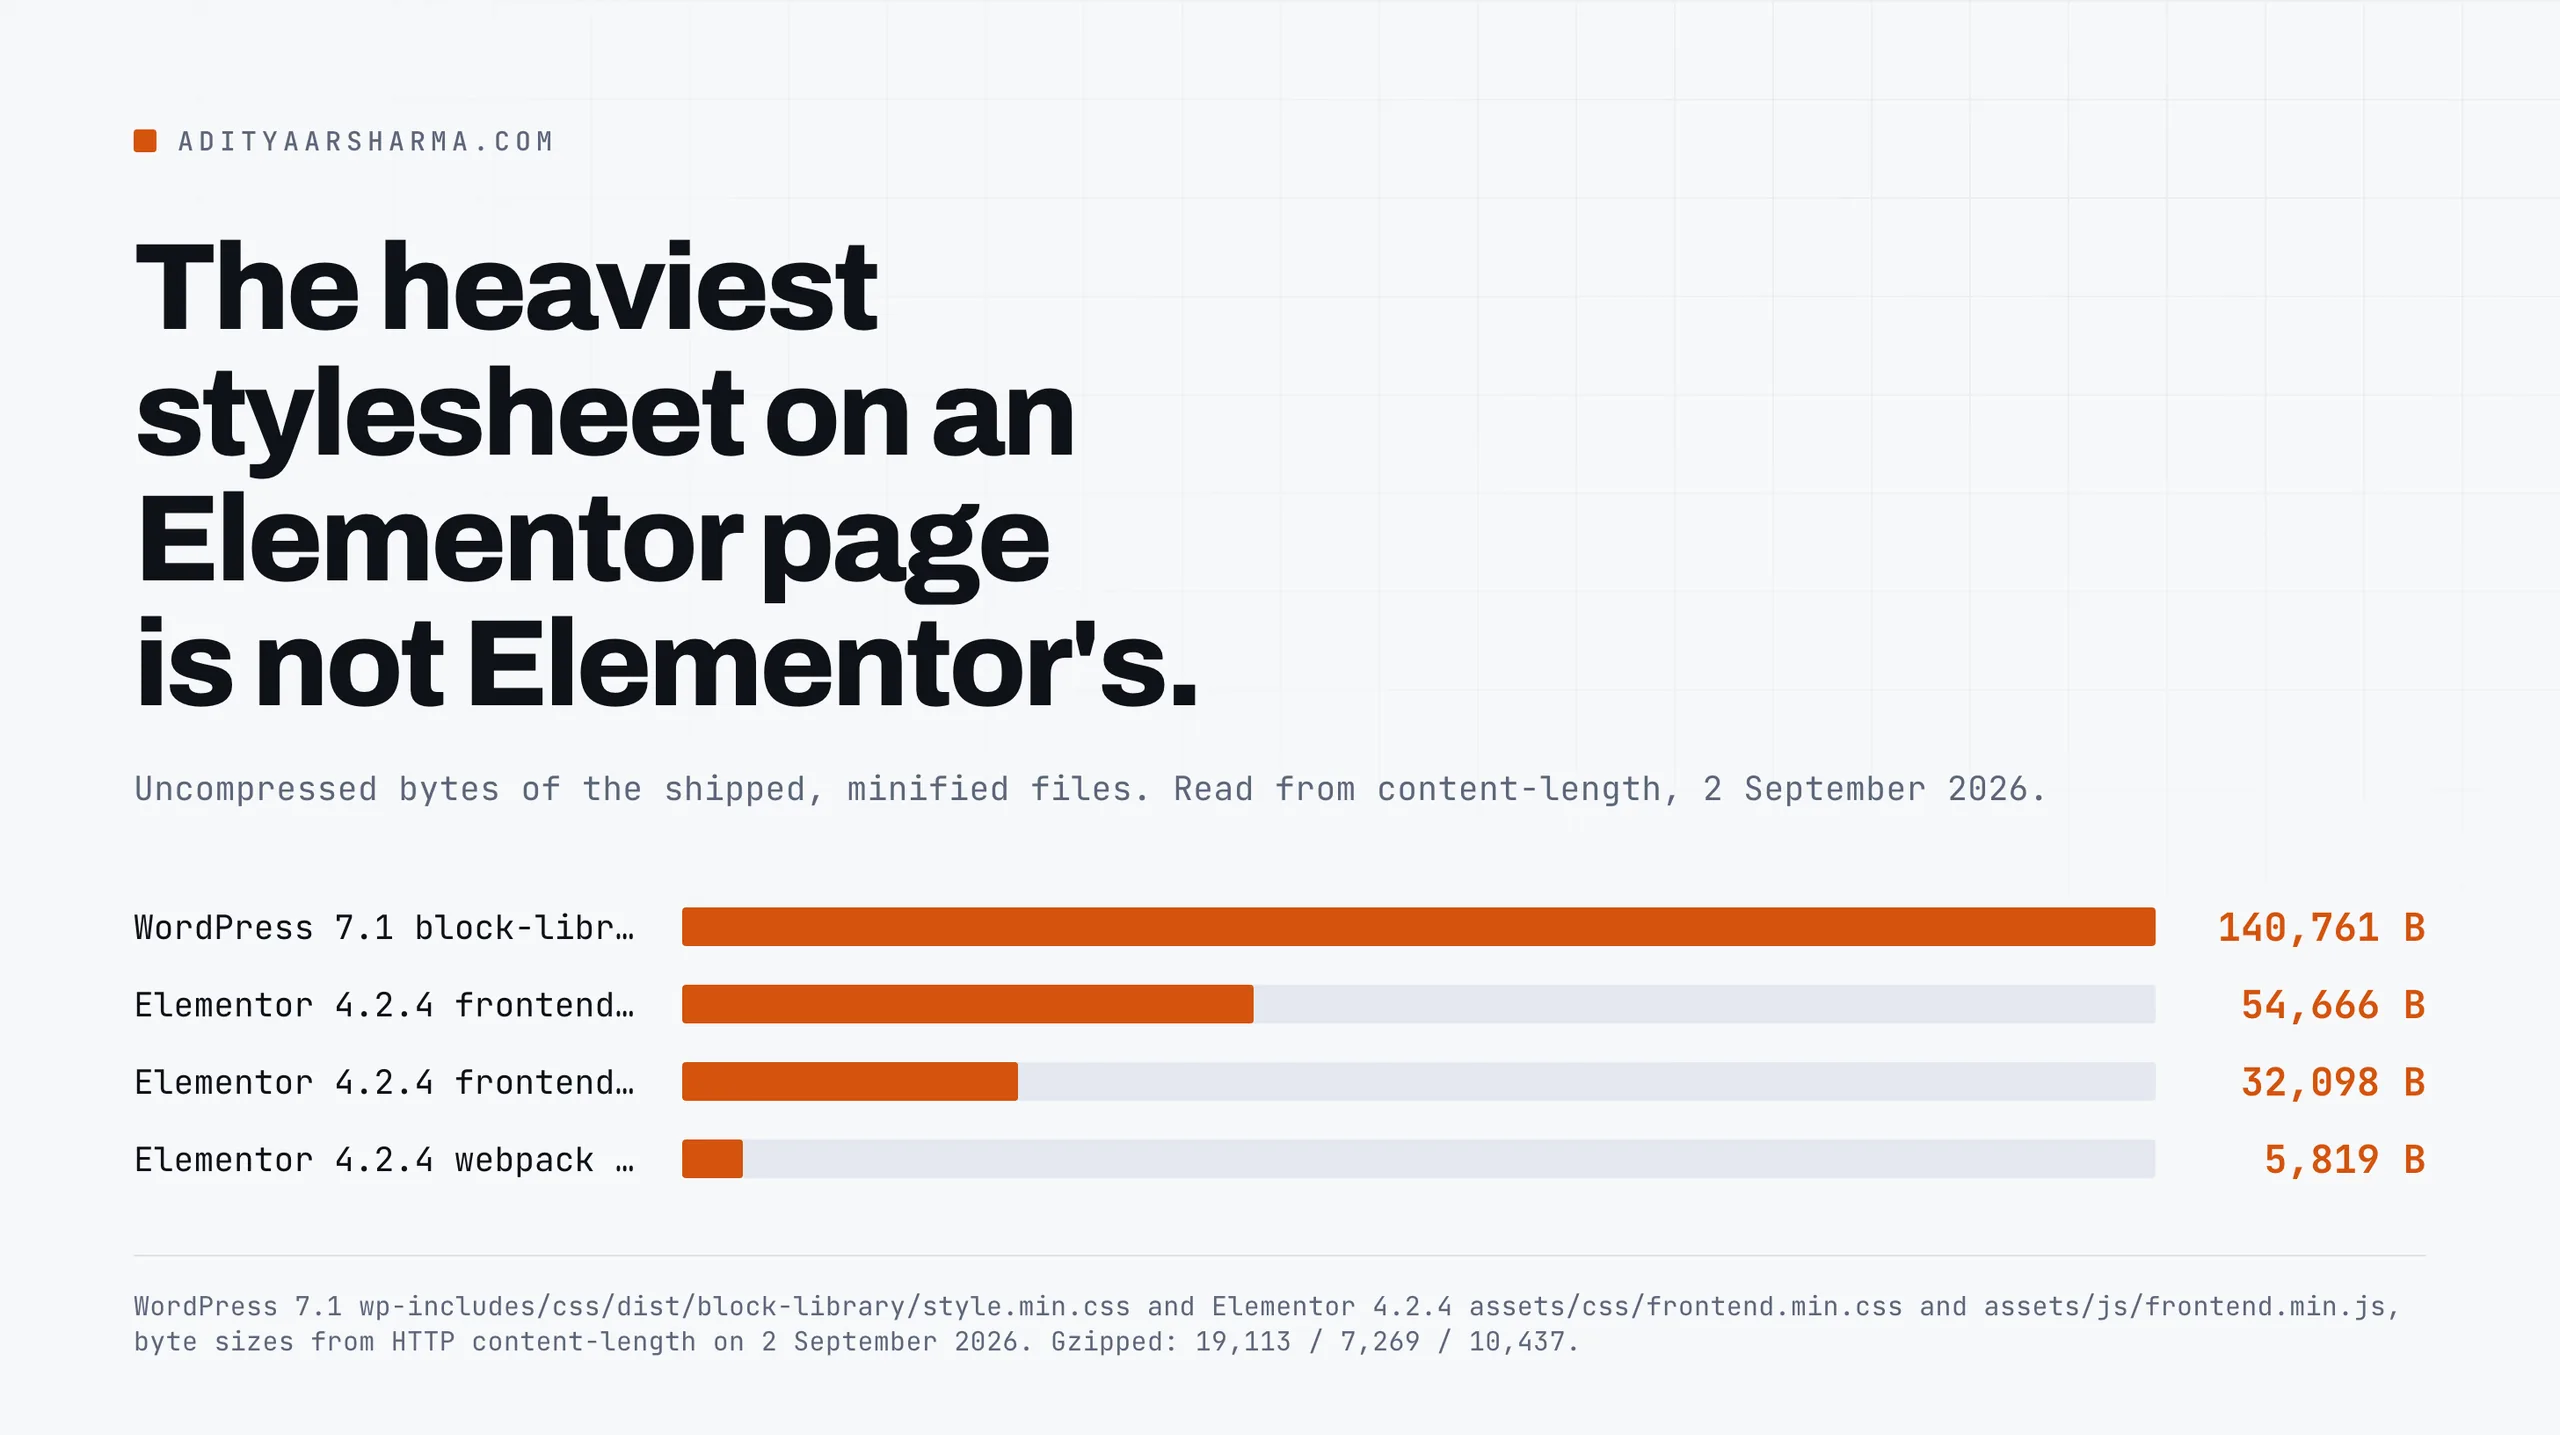
So the base cost of running Elementor is not what makes an Elementor page slow. Three things do, and only one of them is a plugin setting.
This is what each one actually is, where the number comes from, and how to read it on your own site.
One thing I am not going to do here is quote a load time. I did not run a lab, and a page-load number without the host, the theme, the images and the network behind it is decoration.
Everything below is either a byte count I measured, a threshold Google published, or a mechanism I read in the source.
The thresholds, so we are arguing about the same numbers
Google’s Core Web Vitals set and their published targets, all assessed at the 75th percentile of page loads, segmented across mobile and desktop:
| Metric | Good | Poor | Source and date |
|---|---|---|---|
| Largest Contentful Paint | 2.5s or less | over 4.0s | web.dev/articles/lcp, last updated 4 September 2025 |
| Interaction to Next Paint | 200ms or less | over 500ms | web.dev/articles/inp, last updated 2 September 2025 |
| Cumulative Layout Shift | 0.1 or less | over 0.25 | web.dev/articles/vitals, last updated 31 October 2024 |
Separately, Lighthouse’s DOM size audit has its own numbers, and they are the ones that matter for a page builder.
From the Chrome documentation, last updated 21 June 2024: it warns when the body element has more than about 800 nodes and errors when it has more than about 1,400.
It reports three figures, not one: total DOM elements, maximum DOM depth, and maximum child elements.
Why depth costs you twice
Depth is the one page builders push on. A deeply nested tree costs you twice: the browser recomputes position and style down the whole chain on every change, and the memory footprint of the tree itself grows.
That is a responsiveness cost, so it lands on Interaction to Next Paint rather than on load time.
Cost one: DOM depth and node count
Elementor has been cutting wrapper elements out of its output since version 3.0, and its own documentation lists them by release:
| Elementor version | Wrappers removed |
|---|---|
| 3.0 | .elementor-inner, .elementor-row, .elementor-column-wrap |
| 3.2 | .elementor-image, .elementor-text-editor |
| 3.6 | elementor-section-wrap |
| 3.19 | the changes above became part of core and are no longer optional |
Source: Elementor’s Optimized DOM Output documentation, last updated 1 February 2024, and the original developer post from 23 June 2020. That last row is the one that breaks sites.
If any CSS you wrote selects .elementor-column-wrap, it has been dead since 3.19 and no setting brings it back.
Container against Section and Column
The bigger structural lever is Container versus the old Section, Column and Inner Section model. Elementor published a direct comparison of the same visual result built both ways, last updated 18 May 2026:
| Build method | Div elements | Lines of HTML |
|---|---|---|
| Section / Column / Inner Section | 37 | 105 |
| Container | 23 | 76 |
| Reduction | 14 | 29 |
That is their measurement of one section, not mine, and it is a fair one to cite because it is the vendor arguing against its own older feature.
Scaled across a landing page with eight sections, that is the difference between clearing the Lighthouse warning threshold and not.
The Container feature is marked stable in the source, with 'default' => self::STATE_INACTIVE but 'default_active' => true for sites installed on 3.16.0 or later.
In other words, a site built in 2023 or later already has it and an older site probably does not. Turning it off later carries this warning in Elementor’s own experiment definition:
Container-based content will be hidden from your site and may not be recoverable in all cases.
Elementor, core/experiments/manager.php, read 3 September 2026
The Optimized Markup experiment
There is a second lever on the same axis. The e_optimized_markup experiment, titled Optimized Markup, is marked stable, defaults to inactive, and defaults to active only for sites installed on 3.30.0 or later.
Its description in the source is honest about the price:
Reduce the DOM size by eliminating HTML tags in various elements and widgets. This experiment includes markup changes so it might require updating custom CSS/JS code and cause compatibility issues with third party plugins.
Elementor, Optimized Markup experiment description, read 3 September 2026
Experiments are plain option rows, prefixed elementor_experiment-, so you can read the whole set without opening the admin:
wp option list --search='elementor_experiment-*' --format=tableMeasure your own page in the console
And these are the three numbers Lighthouse reports, straight from the console on any page. I ran this to check it returns what it claims before putting it here:
const all = [...document.querySelectorAll('body *')];
const depth = e => { let d = 0; while ((e = e.parentElement)) d++; return d; };
const deepest = all.reduce((a, b) => depth(b) > depth(a) ? b : a);
console.log(all.length, depth(deepest), deepest);
Run that in the console on your worst page.
It prints the node count, the maximum nesting depth, and the deepest element itself. Expand that last one in the console and you can walk the chain of wrappers upward.
That deepest element is the useful output. Walking up from it names the exact chain of wrappers to attack, and on most Elementor pages that chain runs through a nested Inner Section or a widget wrapped in more containers than the design needs.
Some of that nesting is also where the stubborn white space above and below WordPress sections comes from, so you fix two problems with one pass.
Cost two: the CSS files Elementor generates per page
Elementor does not style your page from its shipped stylesheet. It compiles a stylesheet per document. From core/files/base.php and core/files/css/post.php in the current source.
The constants are in core/files/base.php: UPLOADS_DIR is elementor/, DEFAULT_FILES_DIR is css/, FILE_PREFIX is post- and the meta key is _elementor_css.
So every page you build produces wp-content/uploads/elementor/css/post-<ID>.css, enqueued with the handle elementor-post-<ID> and cache-busted with a ?ver= taken from a timestamp stored in the _elementor_css post meta.
The site kit is itself a post, so your global colours and typography arrive as another post-<kitID>.css on every page.
External or internal CSS
There is a switch on how that CSS reaches the browser, and both settings have a real cost.
The switch is one line in the same class. use_external_file() returns true unless get_option( 'elementor_css_print_method' ) is internal.
| elementor_css_print_method | What happens | What it costs |
|---|---|---|
| external (default) | A real .css file per post, enqueued normally | One extra render-blocking request per page, and the file has to exist on disk when the request arrives |
| internal | The whole blob goes into _elementor_css meta and prints as <style id="elementor-post-ID"> | No extra request, but the CSS is re-sent inside the HTML on every page view and never enters the browser cache |
External is the right default for a site people browse across several pages, because the kit CSS is then cached once and reused.
Internal wins on a single landing page with paid traffic, where almost every visit is one page view and a saved request is worth more than a cache entry you will never use again.
The file-existence problem is real enough that Elementor added an alpha experiment for it, e_optimized_css_files, described in the source as keeping external CSS files available and consistent for sites behind page caching or a CDN.
If you have ever seen an Elementor page render unstyled after a deploy or a cache purge, that is the failure it addresses.
wp option get elementor_css_print_method
ls -la wp-content/uploads/elementor/css/ | head -20
du -sh wp-content/uploads/elementor/css/
Two notes on that directory
Two operational notes on that directory. It is generated, so it is safe to delete and it will rebuild, which is what Clear Files & Data does.
And because these files are written at render time, they are also why custom CSS appears not to apply until you clear them.
Media queries in generated files are subject to source order like any other CSS, which is the usual reason for a media query in WordPress that refuses to take effect.
Cost three: assets that load whether or not you used them
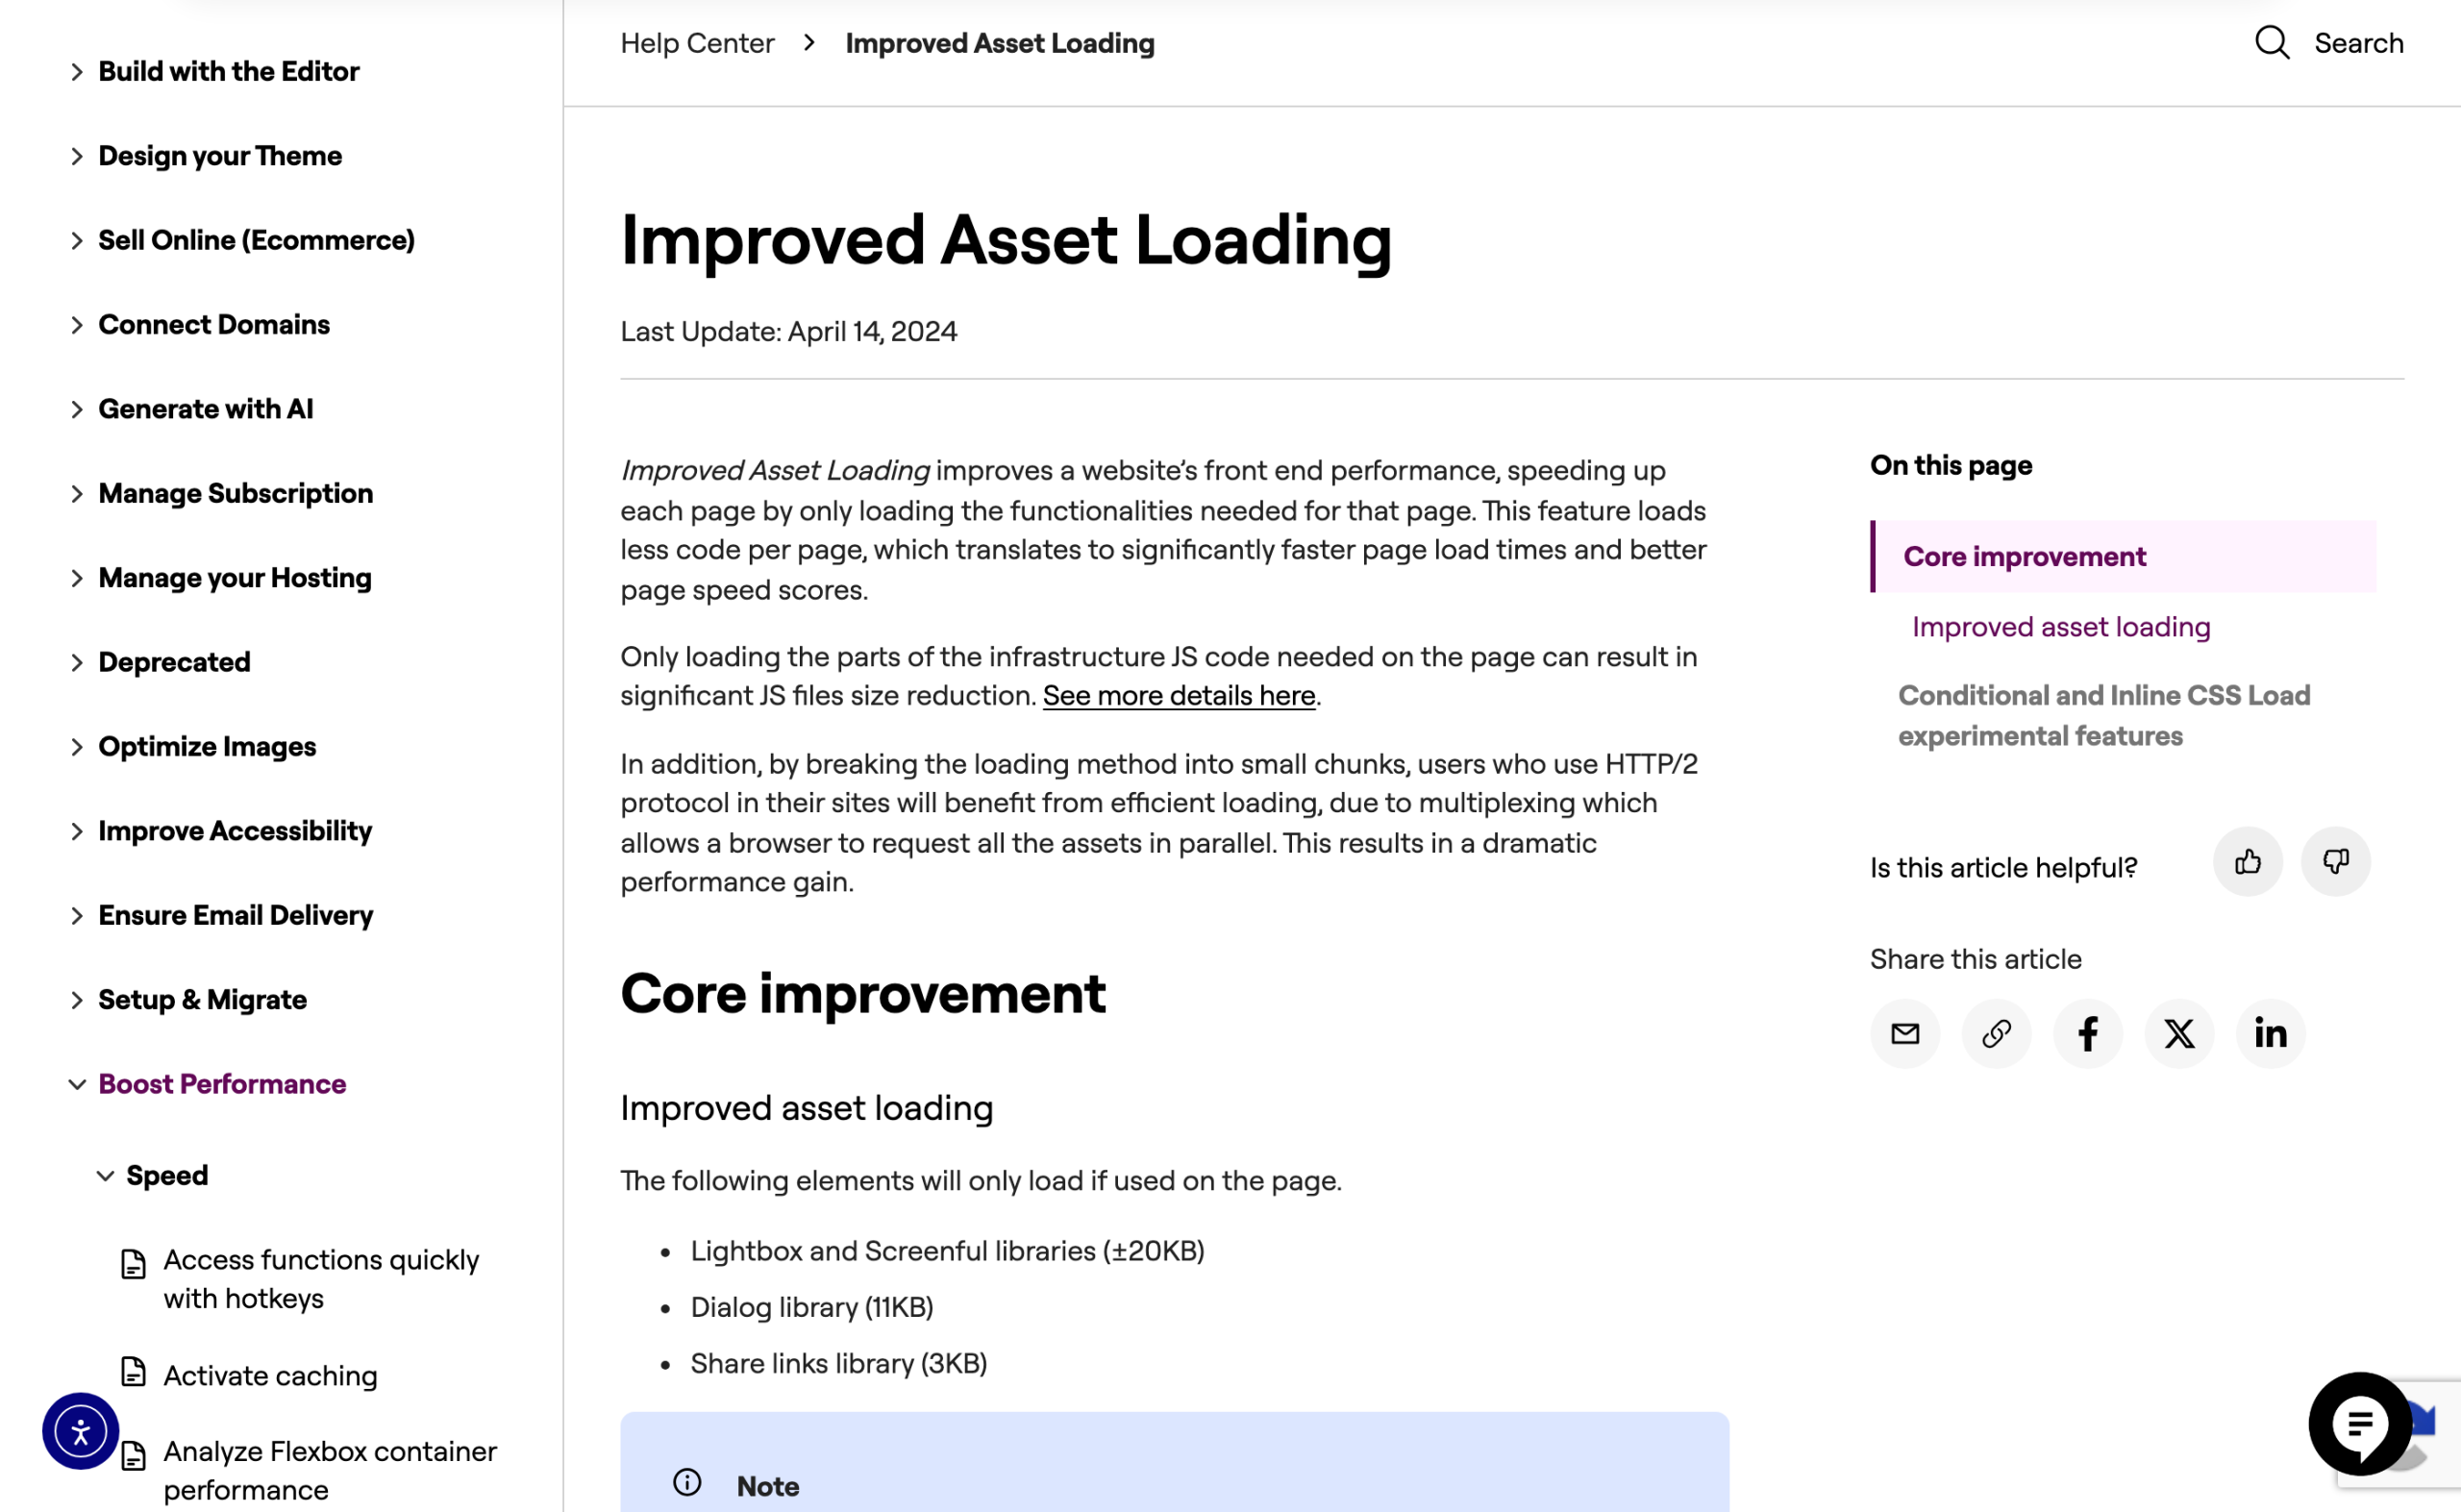
Elementor’s Improved Asset Loading only enqueues a widget’s JavaScript handler when the widget is on the page. The developer post announcing it for 3.1.0, dated 29 December 2020, gives the size effect directly:
| Optimized mode | Assets file size reduced by |
|---|---|
| Disabled | up to 6KB |
| Enabled | up to 177KB |
Which libraries move behind the gate
The named libraries that move behind that gate, from the current help page, last updated 14 April 2024: Lightbox and Screenful at about 20KB, the Dialog library at 11KB, and the Share Links library at 3KB.
The documentation also notes the limit, which is worth quoting because it explains most of the reports that the feature does nothing:
This feature only applies to Elementor Core widget handlers (JS files), and the Swiper library in Elementor and Elementor Pro instances. 3rd party addons may cause potential conflicts if they have not optimized their plugins to use this feature properly.
Elementor, Improved Asset Loading help page, last updated 14 April 2024
Elementor’s position on the wider question, from a help page last updated 29 January 2024, is that unused widgets, fonts and icons cost nothing because their assets are not enqueued on pages that do not use them.
That matches the source: handle_page_assets() reads a per-post assets list out of post meta and enables only those. Which means the widget-disabler plugins people install for Elementor are solving a problem that third-party addon suites have, not one that Elementor core has.
Fonts and icons
The generated CSS meta carries a fonts array, and each Google font family in it becomes a request to a third-party origin unless you host it yourself.
That is a DNS lookup, a TLS handshake and a render-blocking stylesheet before your text can paint, which lands directly on Largest Contentful Paint if your hero is text.
Icons are the cheaper win. The e_font_icon_svg experiment, titled Inline Font Icons, is stable and defaults to active for sites installed on 3.17.0 or later.
Its description in the source: it renders icons as inline SVG without loading the Font Awesome and eicons libraries and their related CSS files and fonts.
On an older site where it is off, turning it on removes an icon font file and a stylesheet from every page.
If you go further and upload your own vector icons, read what actually happens when Elementor accepts an SVG upload first, because the sanitizer changes the file.
Element caching is a server lever, not a payload lever
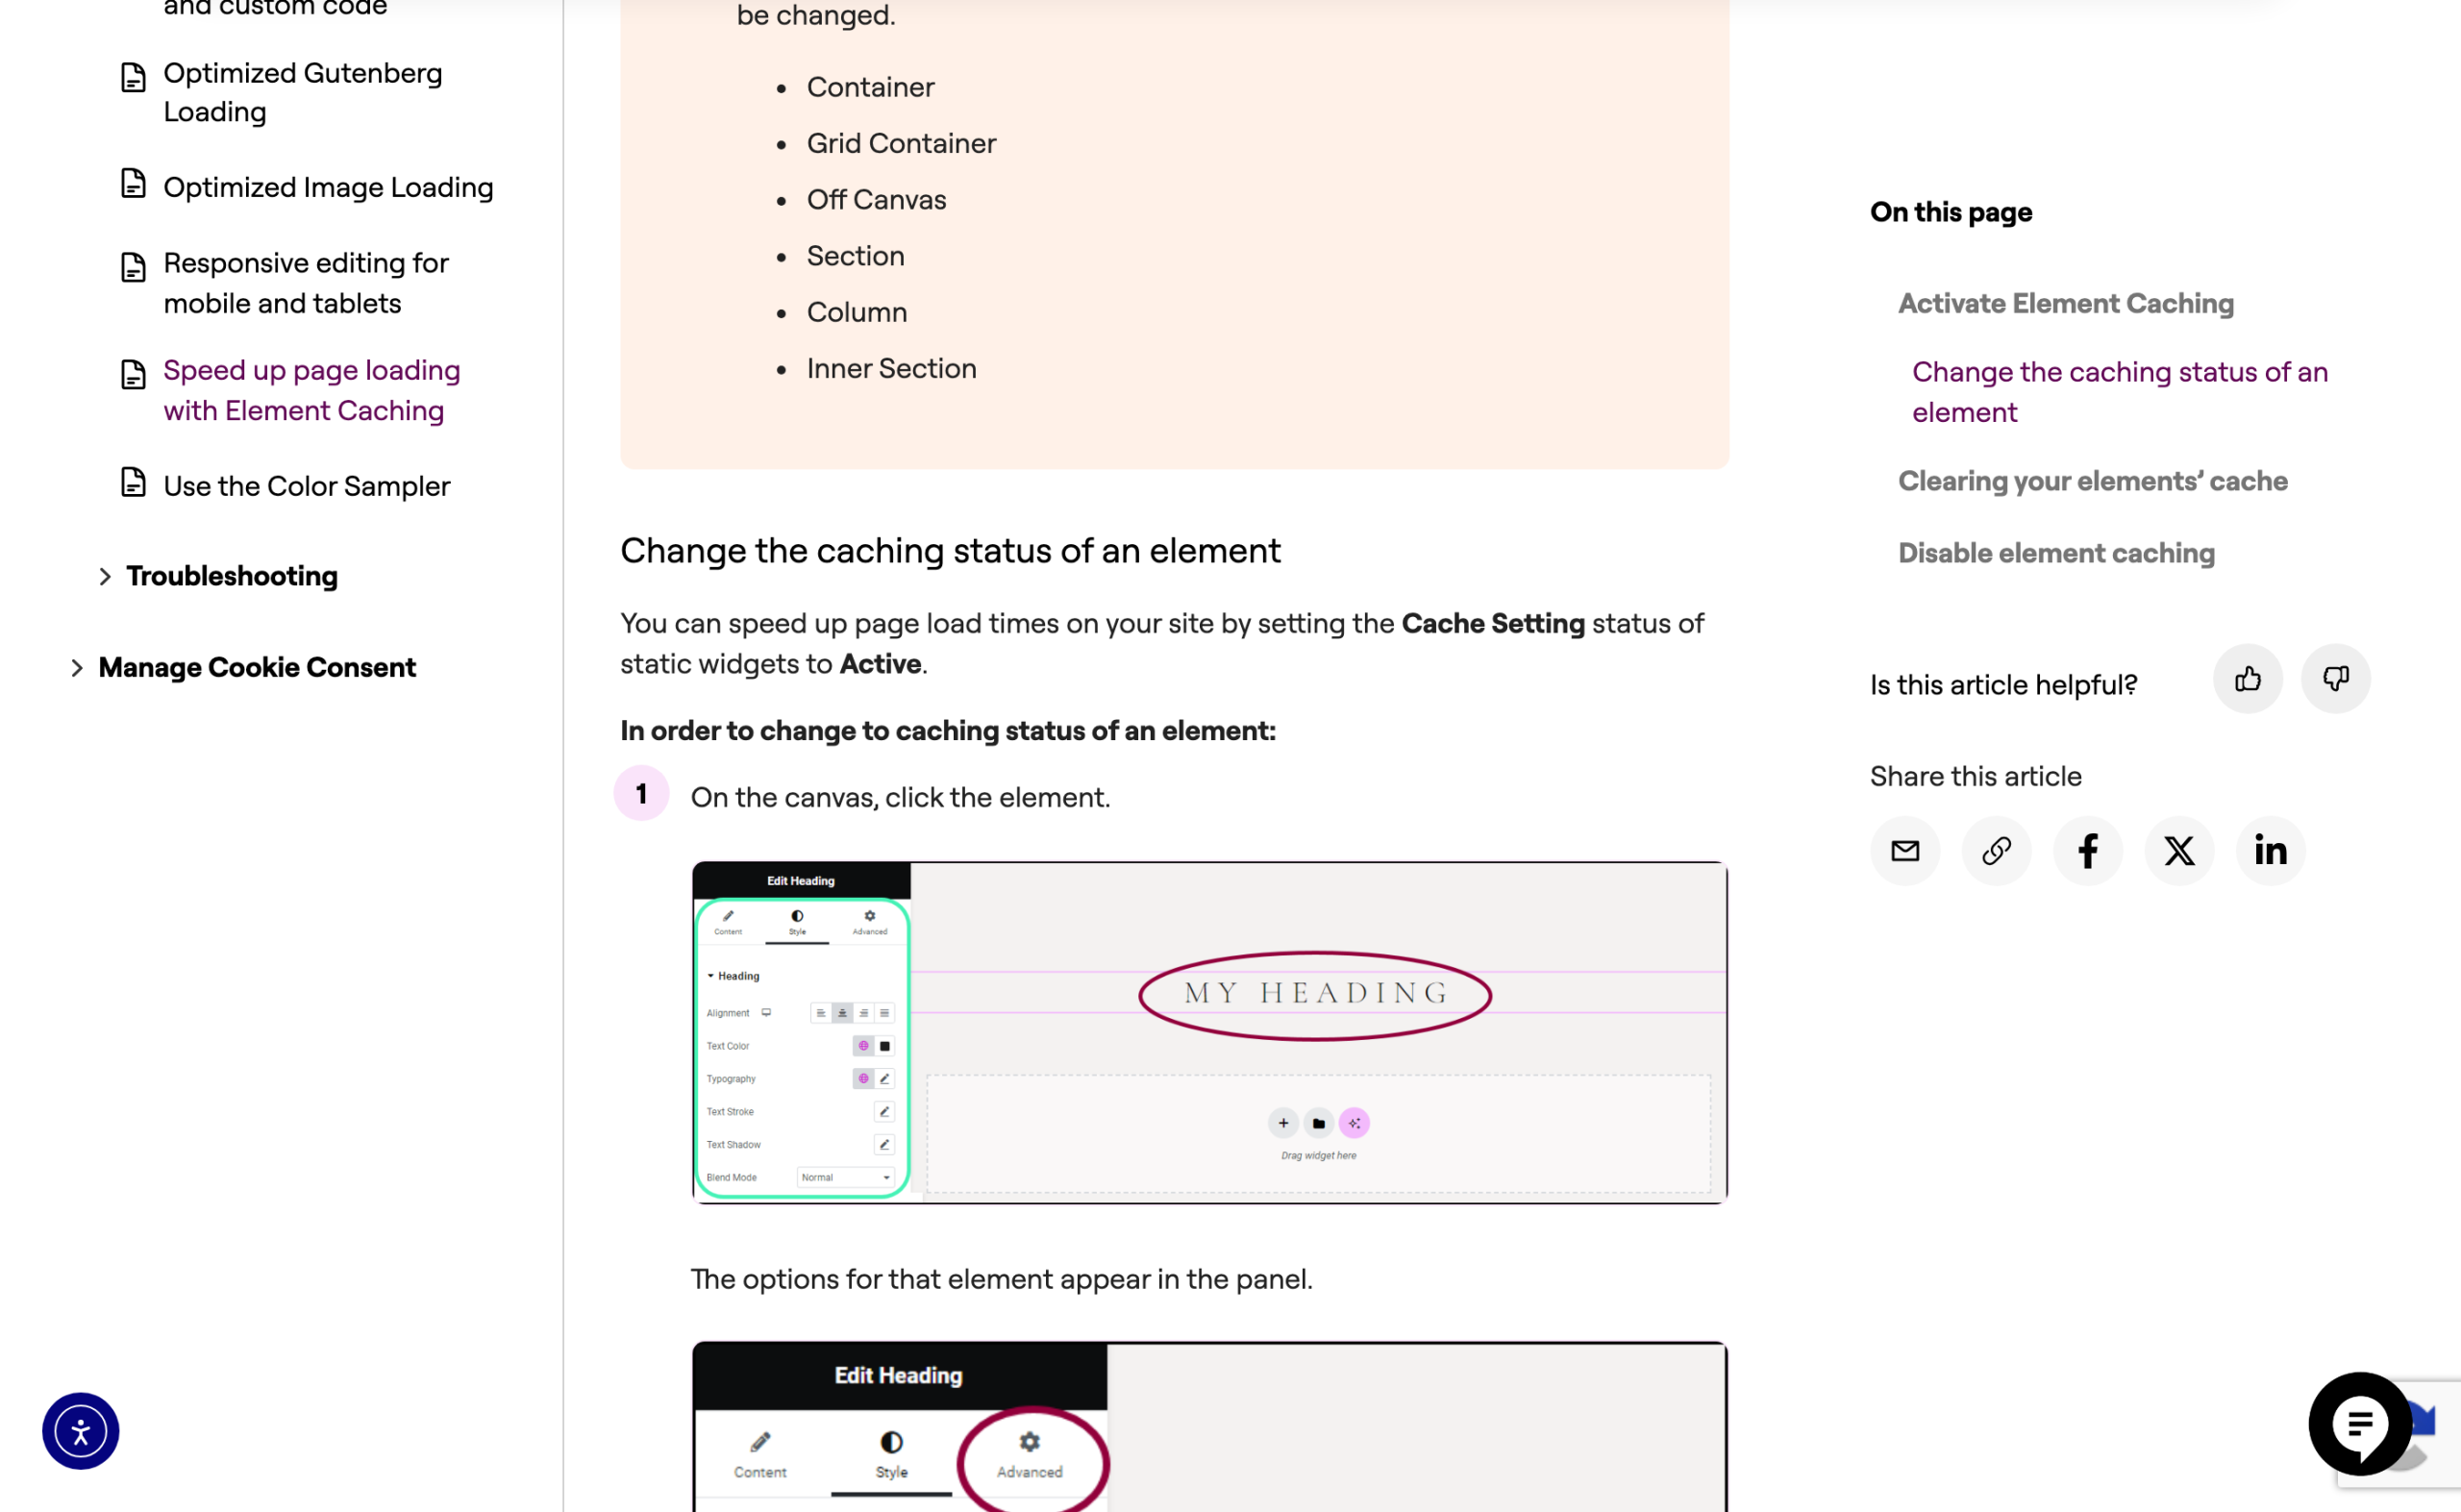
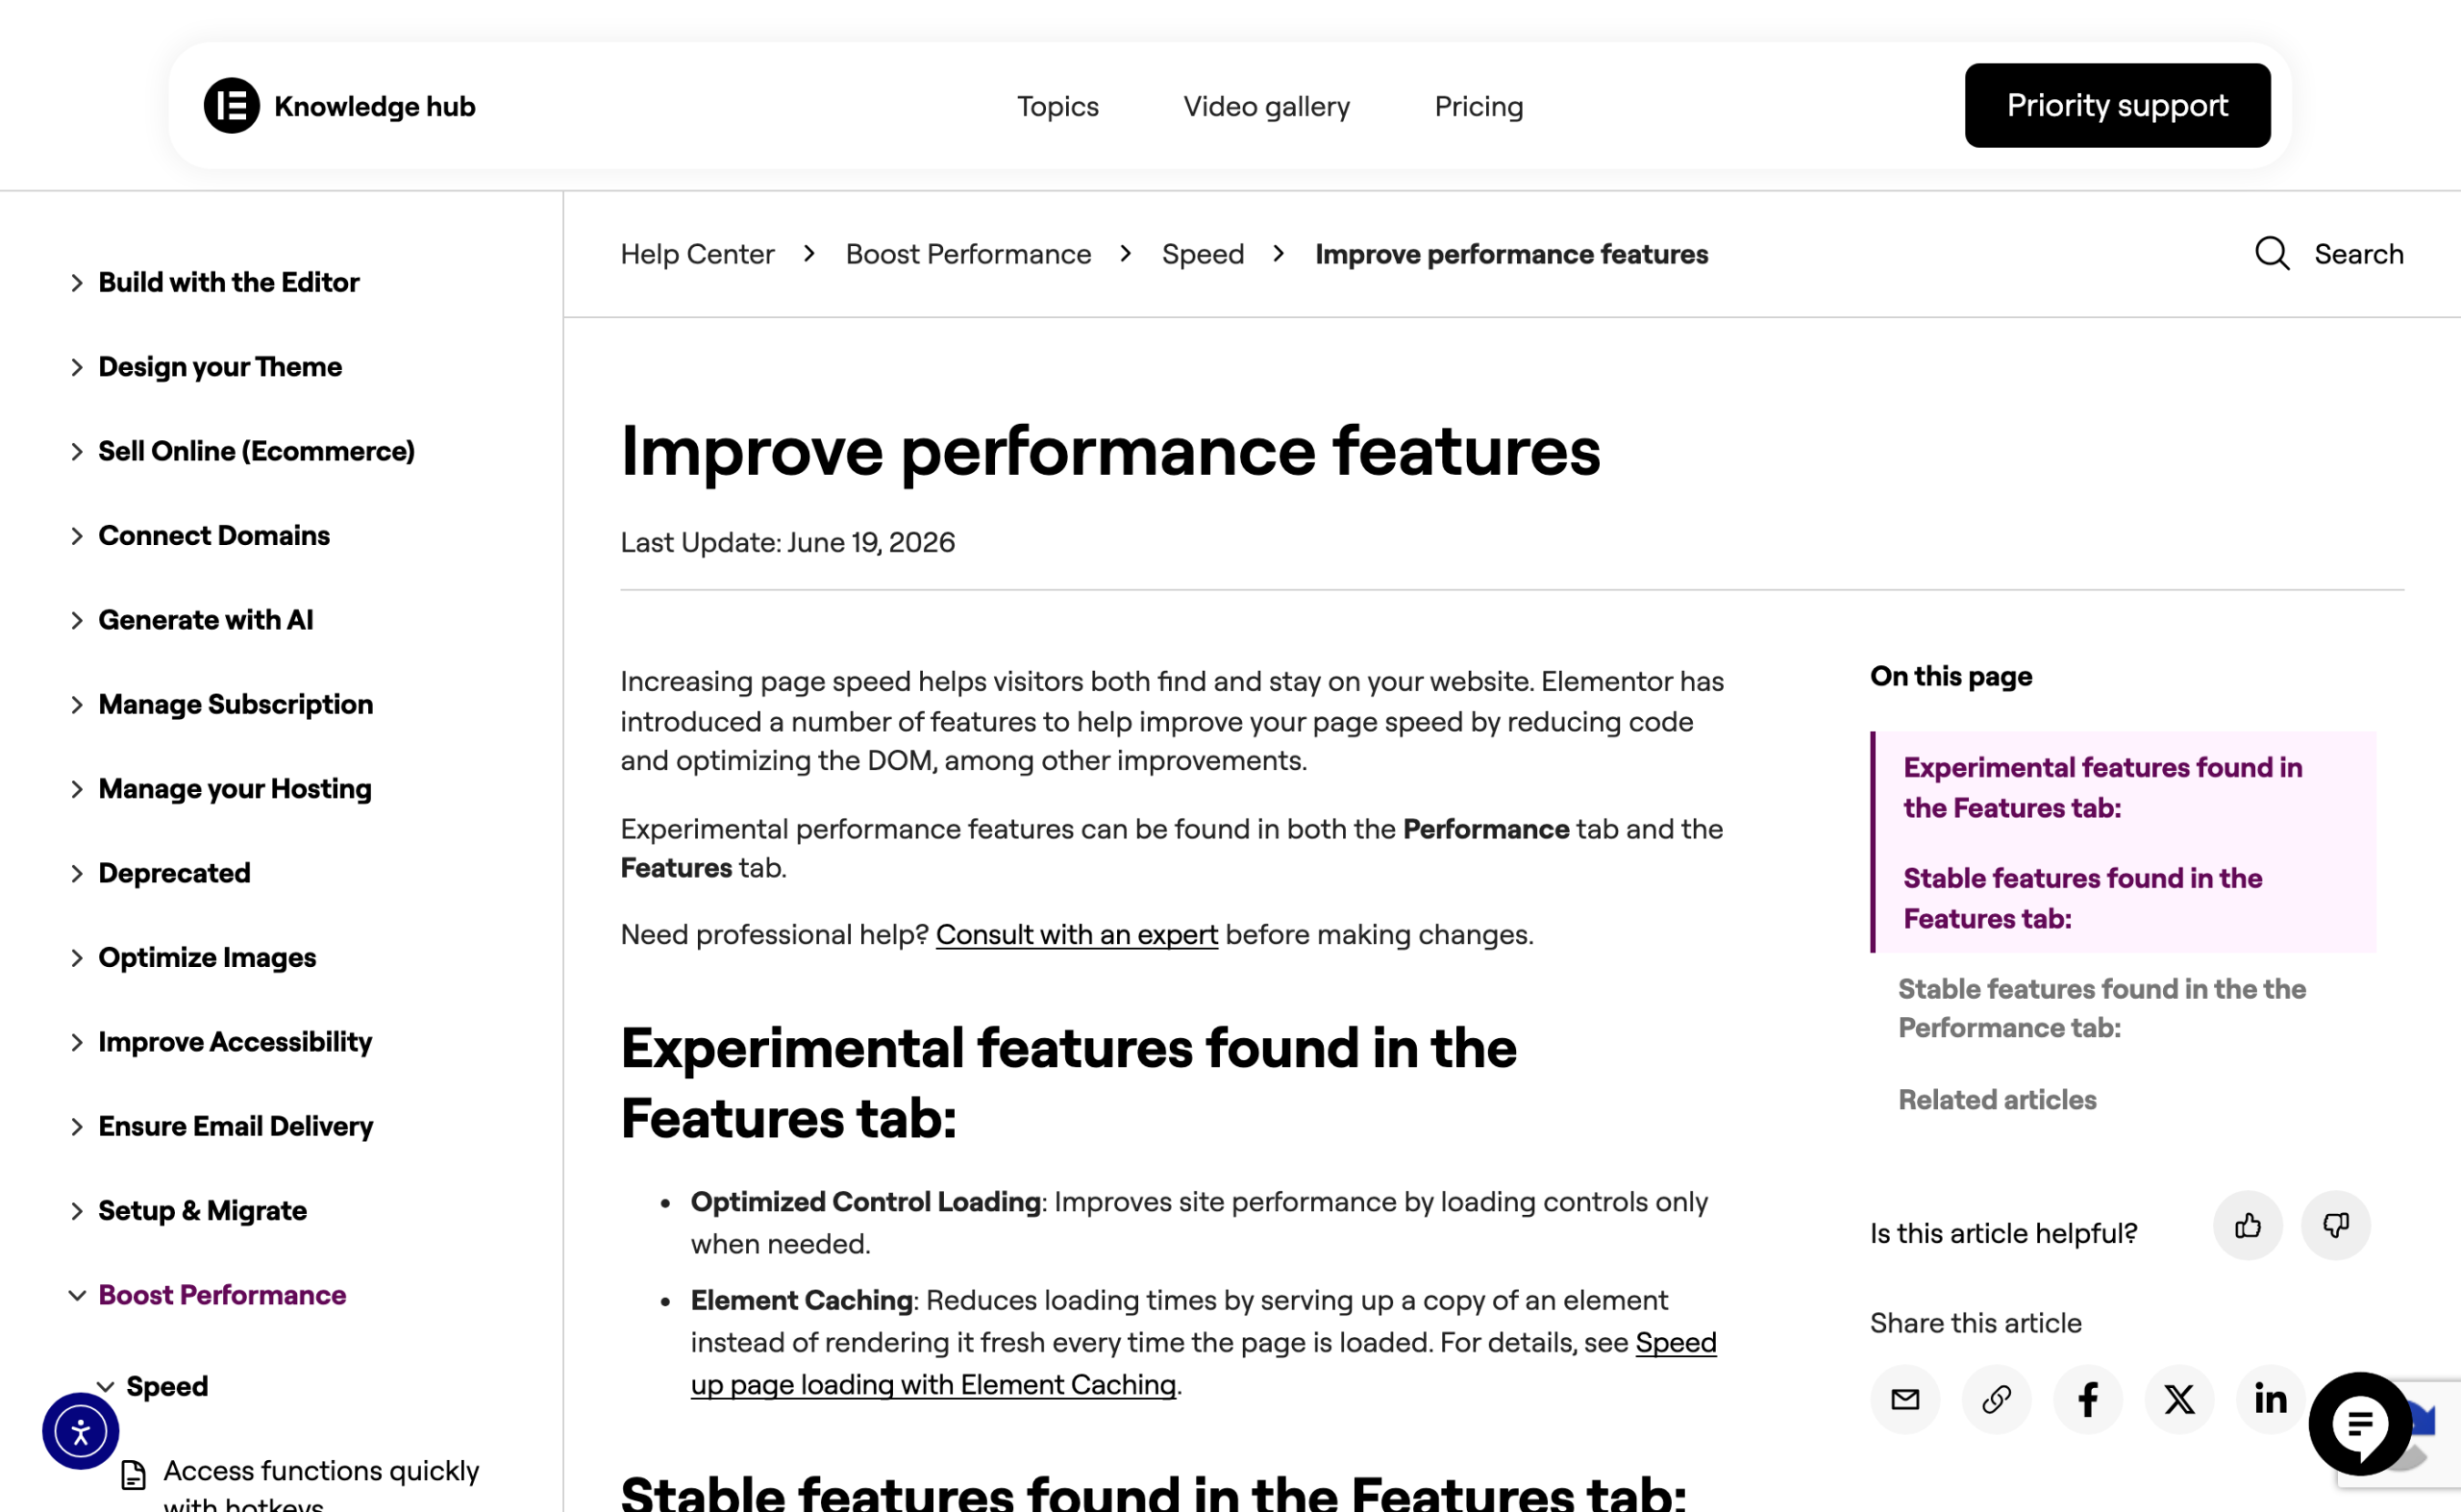
Element Caching stores a widget’s rendered HTML in the _elementor_element_cache post meta and serves it instead of re-rendering. Elementor’s own framing, from the help page last updated 19 June 2026, is that it reduces server memory usage and Time To First Byte.
It does not remove a single byte
Read that carefully, because it is the part people get wrong. It does not remove a single byte from what the browser downloads. The HTML is identical. What it changes is how long your server takes to produce it.
If your Largest Contentful Paint problem is a 900KB hero image, element caching will not move it. If it is a slow shared host with a heavy theme, it will.
The settings, from modules/element-cache/module.php: the site-level elementor_element_cache_ttl option defaults to 24 hours, with values from one hour to one year plus disable. Containers, Grid Containers, Off Canvas, Sections, Columns and Inner Sections are cached automatically and cannot be opted out.
Everything else is per-widget through a _element_cache control on the Advanced tab.
The cache is flushed on these hooks, which is a better list than the documentation gives:
activated_pluginanddeactivated_pluginswitch_themeupgrader_process_completeupdate_option_elementor_element_cache_ttl
The hard rule is in the documentation and it is worth repeating: do not cache an element containing a dynamic tag or a shortcode that renders per-visitor data.
A cached widget that greets the wrong person by name is a worse outcome than a slow page.
The order I would actually work in
- Run the DOM snippet above on your worst page. If the node count is over 1,400 you have a structural problem and no setting will fix it. Rebuild that page’s layout with Containers and delete the Inner Sections.
- Check
wp option list --search='elementor_experiment-*'. Ife_font_icon_svgis inactive on a site older than 3.17, turn it on. Ife_optimized_markupis inactive, test it on staging, because it will move your custom CSS. - Host your fonts locally or cut them to one family and two weights. This is usually the largest single win on a text-led page and it needs no plugin.
- Compress your images. Bulk-compressing WordPress images is boring and it beats every builder setting on a page whose Largest Contentful Paint element is a photograph.
- Only now decide between internal and external CSS, and only if you have a reason from your own analytics about how many pages a session touches.
- Element caching last, and only if your Time To First Byte is the measured problem.
What none of this covers
Two things worth saying plainly about what none of this covers. A child theme changes none of these numbers, which is a separate question with its own answer in whether you actually need a child theme with Elementor.
And custom CSS you add through the editor compiles into the same generated files described above, so custom link colours added in Elementor cost you nothing extra in requests but do end up subject to the same cache-clearing behaviour as everything else.
Go and run the DOM snippet on your slowest page and expand the deepest element it logs. If the chain of wrappers above it runs longer than about a dozen elements, that chain is your afternoon.
Resources
- Web Vitals overview on web.dev (metric set and thresholds)
- Largest Contentful Paint on web.dev
- Interaction to Next Paint on web.dev
- Avoid an excessive DOM size, Chrome Lighthouse documentation
- Optimized DOM Output and custom code (Elementor, last updated 1 February 2024)
- Analyze Flexbox container performance (Elementor, last updated 18 May 2026)
- Improved Asset Loading (Elementor, last updated 14 April 2024)
- New Experiment: Optimized Asset Loading Mode (Elementor developers, 29 December 2020)
- Speed up page loading with Element Caching (Elementor, last updated 19 June 2026)
- Elementor experiments manager source on GitHub
Watch this part instead
I walk through a live Core Web Vitals optimisation on a real site in this one.
