Reading Your WordPress Access Logs for the Things Scanners Will Not Tell You
On this page, 8 sections
When Rocketgenius published its notice about the compromised Gravity Forms packages on 11 July 2025, it told people to check for infection by requesting one URL on their own site: /wp-content/plugins/gravityforms/notification.php?gf_api_token=[the token published in the notice]&action=ping.
Read that as a defender
Read that as a defender rather than as a victim.
If your site was hit, that request had already been made, by someone else, days earlier, and it is sitting in your access log with a status code and a timestamp next to it.
No scanner was required to know. The information was in a text file the whole time.
Scanner answers files, log answers events
That is the difference worth internalising. A malware scanner answers “what is in my files right now”. An access log answers “what did my server do, and when”.
Only one of those is a record of events, and it is the one nobody opens.
I went looking for the patterns that actually separate a compromise from the constant background noise, tested every command below against a log file, and this is what came out.
Finding the log, and reading the fields
Common locations: /var/log/nginx/access.log, /var/log/apache2/access.log, ~/logs/ or ~/access-logs/ on cPanel, and a per-application path on managed stacks. If you cannot find it, ask your host where it writes and how long it keeps it.
Do that today rather than during an incident, because retention is usually shorter than you assume.
The field map both formats share
Both Apache’s combined format and nginx’s default combined produce the same field order, which is why the same one-liners work on either:
203.0.113.10 - - [01/Sep/2026:03:11:09 +0000] "POST /wp-login.php HTTP/1.1" 302 0 "-" "Mozilla/5.0 (X11; Linux x86_64)"
     $1                    $4                    $6      $7                  $9  $10  $11        $12 onward
Which field is which
In awk, space splitting gives you $1 for the client IP, $4 for the timestamp, $6 for the method with its opening quote attached, $7 for the path and $9 for the status.
The referrer and user agent contain spaces, so split on the quote character for those: with -F'"', $4 is the referrer and $6 is the user agent. Everything below uses that.
Include rotated files whenever you are looking back more than a day: { cat access.log; zcat access.log.*.gz 2>/dev/null; } | wc -l.
Seven patterns worth grepping for
1. A POST to a PHP file under uploads
The uploads directory is written to by the application and served as static content. Nothing legitimate in a normal WordPress install accepts a POST there.
The query is awk '$6 ~ /"POST/ && $7 ~ /wp-content\/uploads\// {print $1, $4, $7, $9}' access.log.
One hit with a 200 is a web shell being driven. Follow it up on disk with find wp-content/uploads -type f -name '*.php', which should return nothing at all.
2. Any successful POST to a PHP file outside the core entry points
Wider than the first, and better. WordPress only ever receives POSTs at a handful of known files. Everything else is worth a look.
awk '$6=="\"POST" && $7 ~ /\.php/ && $9 ~ /^2/ {print $1, $7, $9}' access.log \
  | grep -Ev '/(wp-login|wp-cron|admin-ajax|xmlrpc|wp-comments-post)\.php'
What a clean result looks like
You will get a few legitimate results from plugins with their own endpoints. Learn them once, add them to the exclusion list, and after that the output is either empty or interesting.
3. Logins that actually succeeded
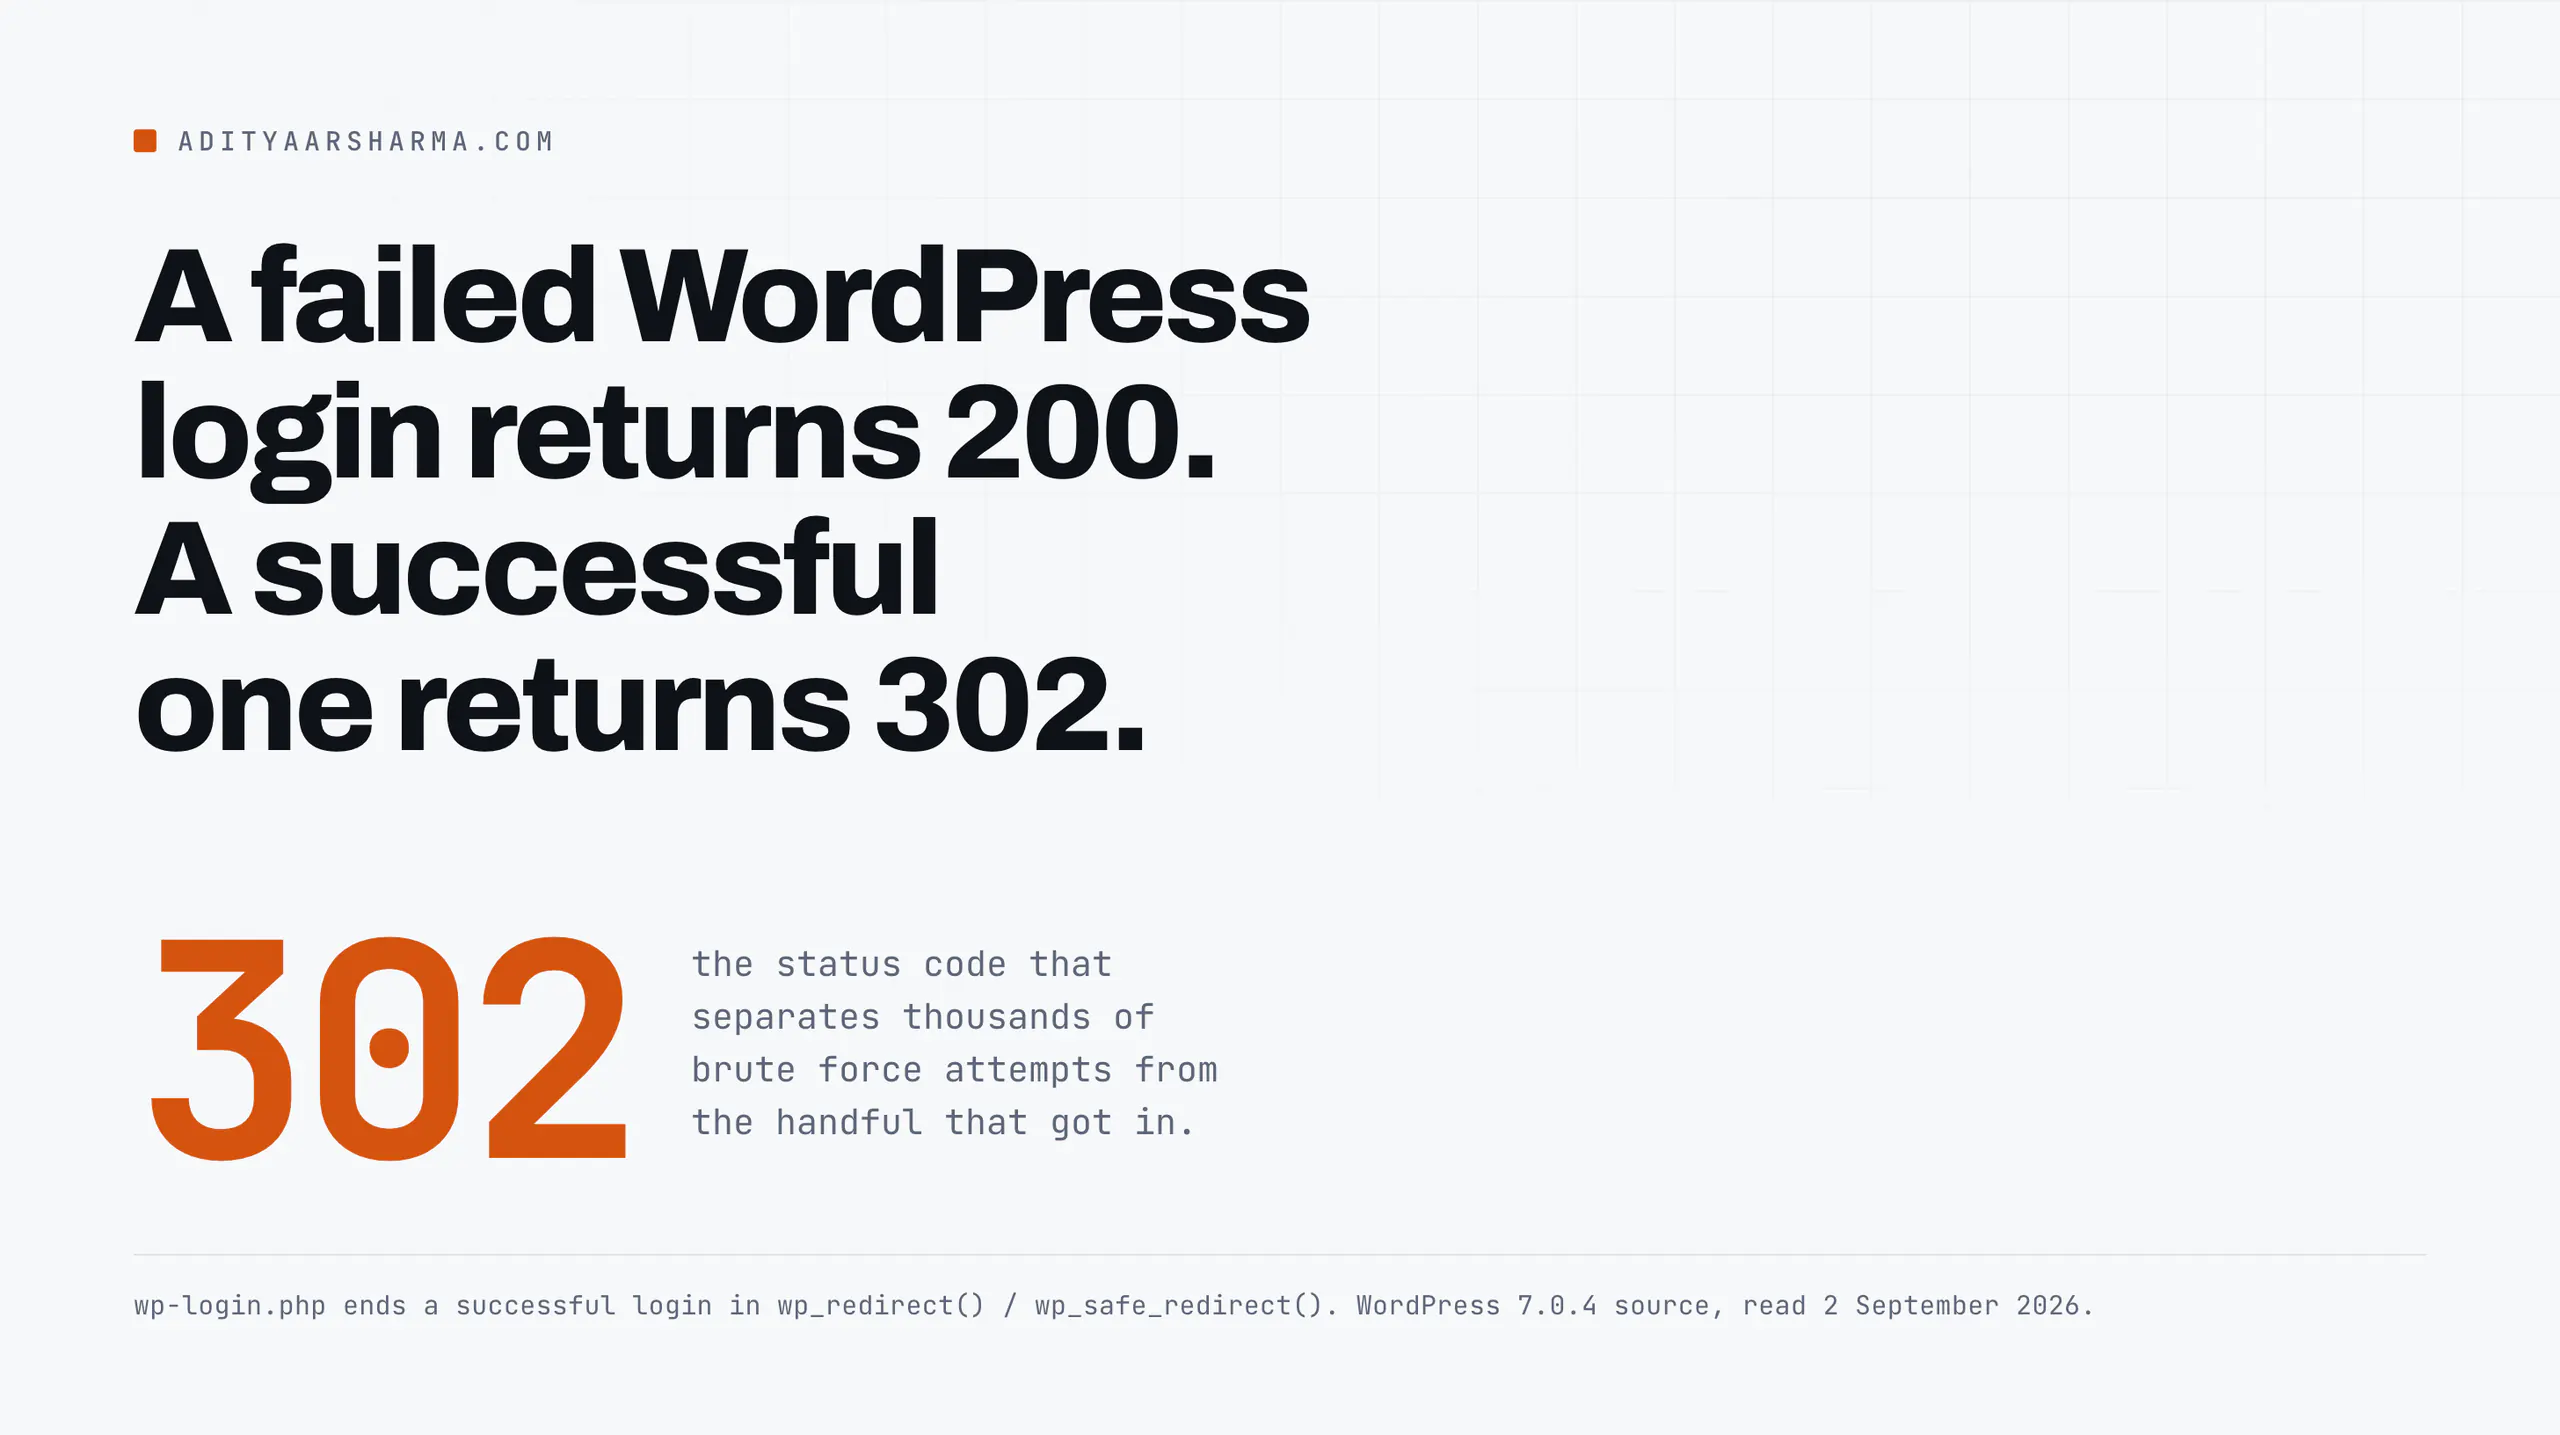
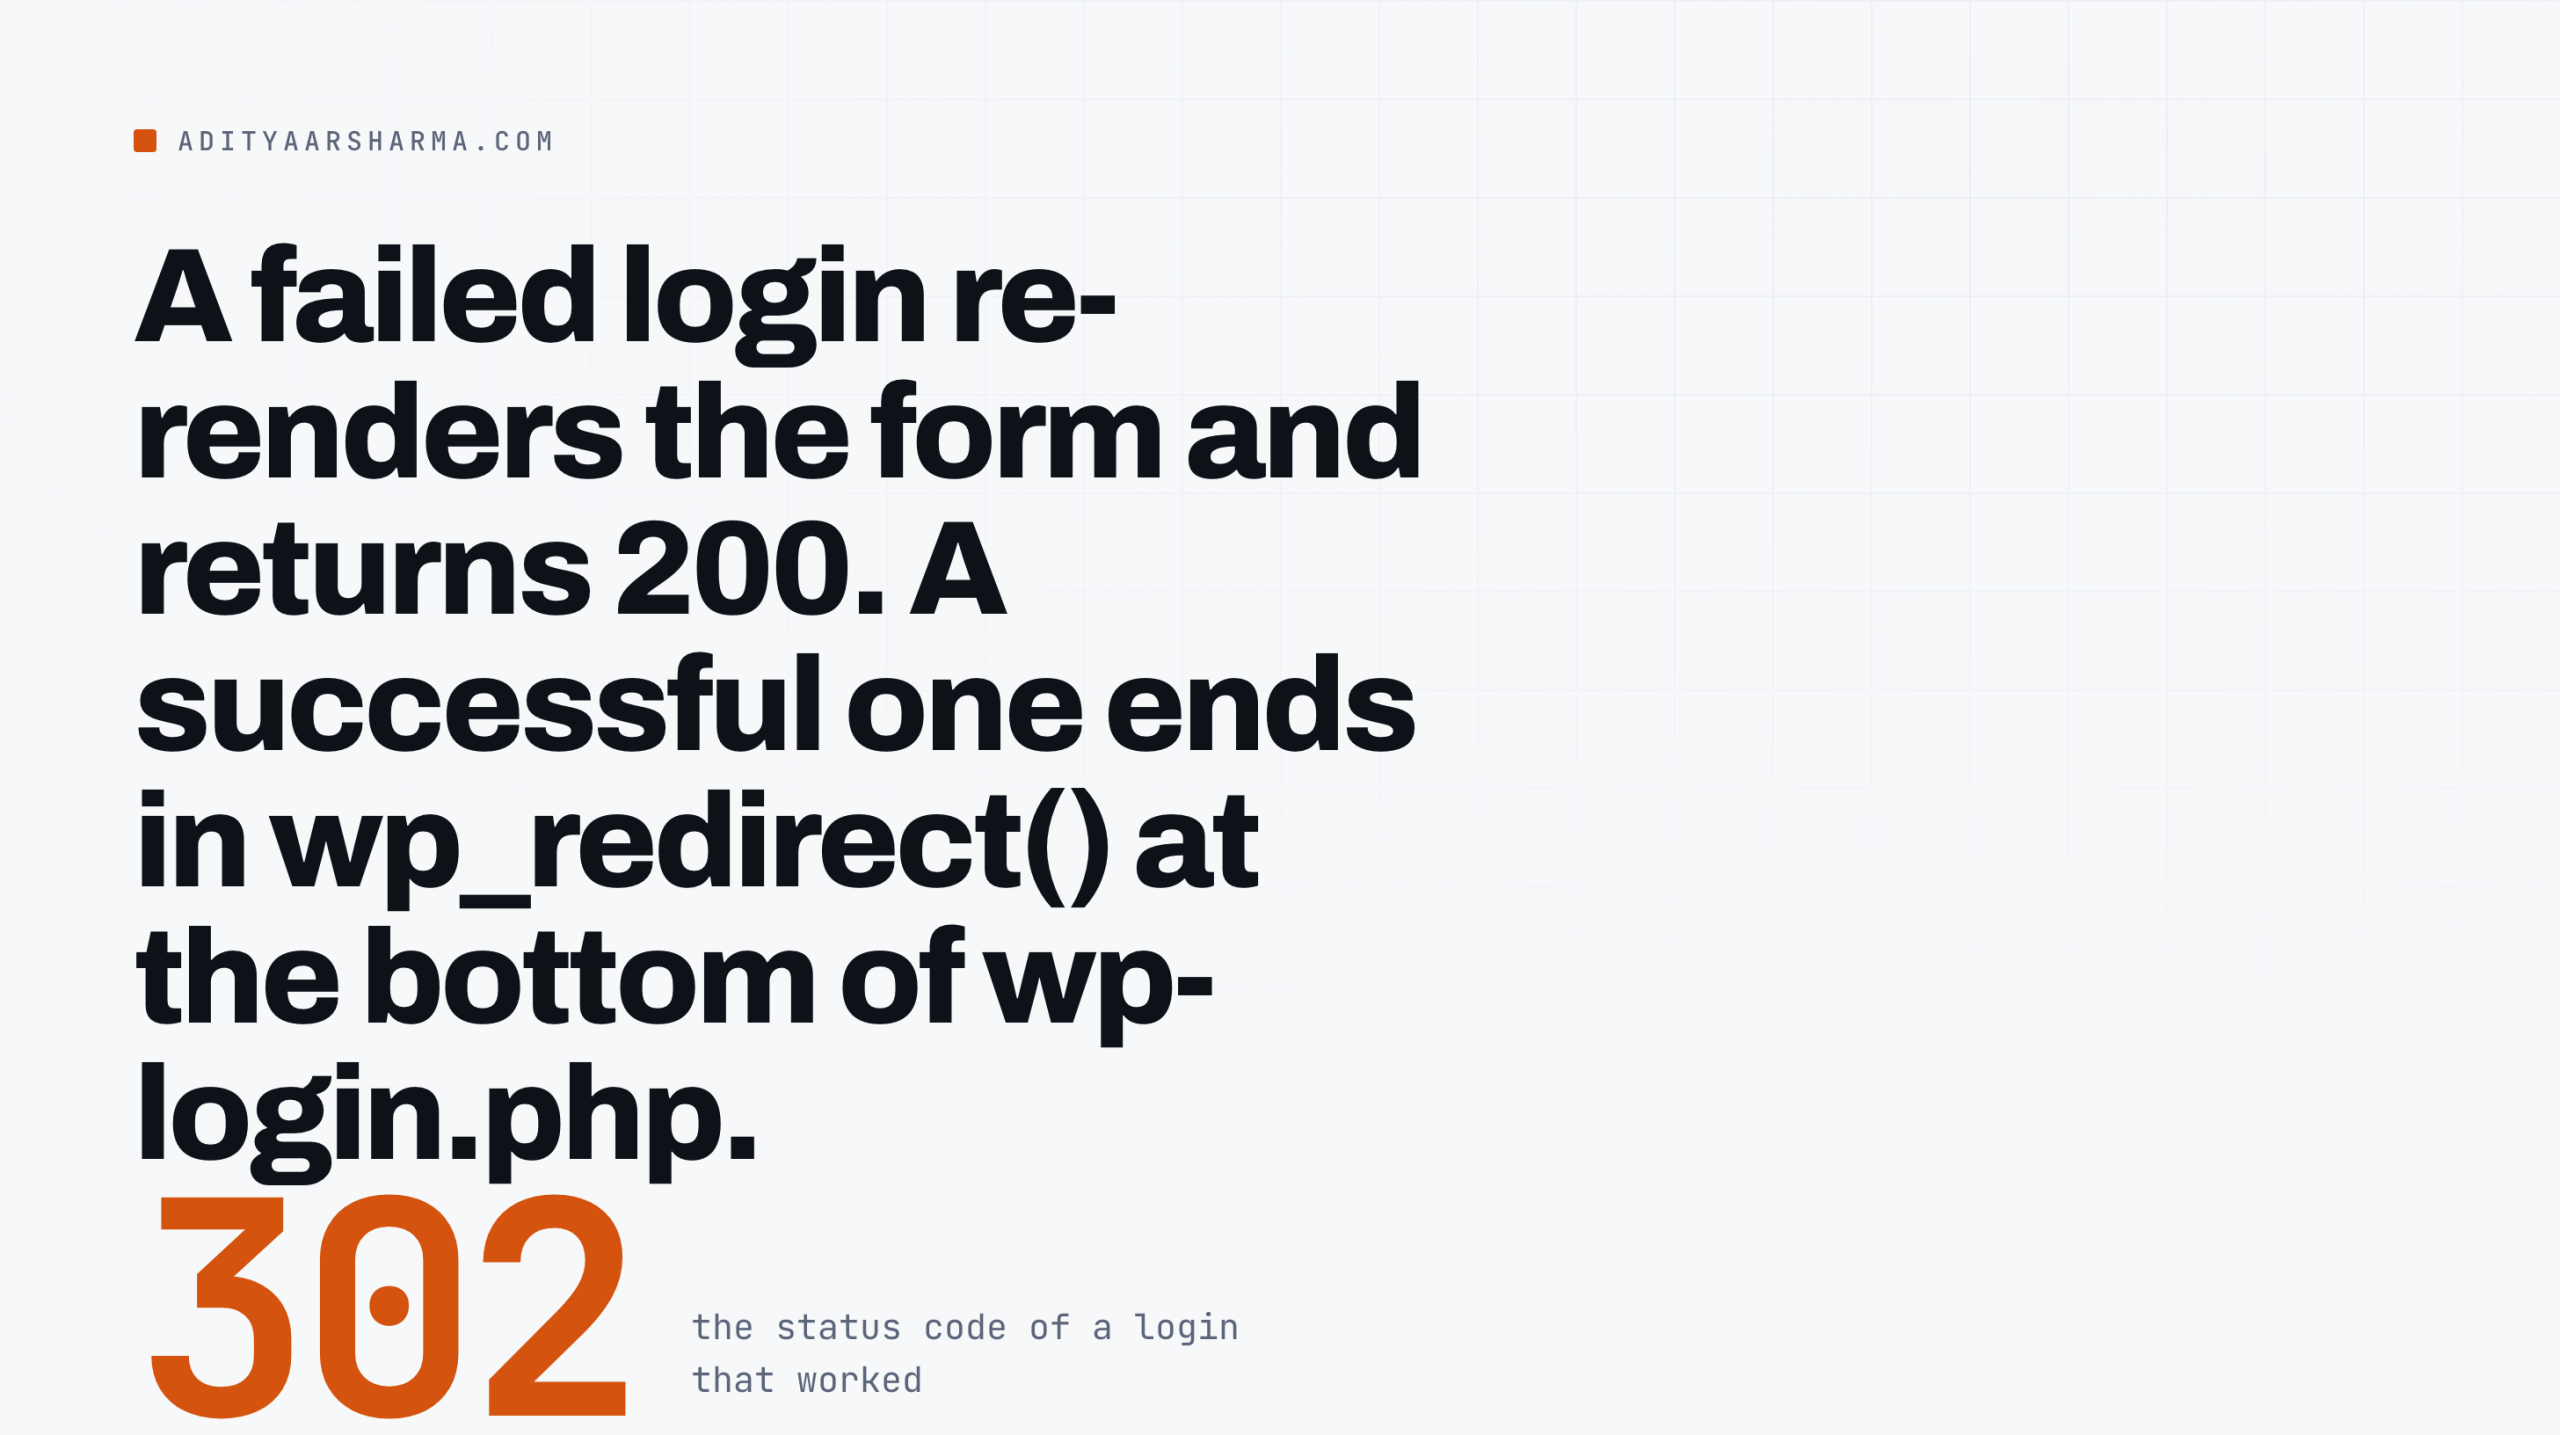
This one surprises people. A failed login re-renders the form and returns 200. A successful login ends in wp_redirect() or wp_safe_redirect() at the bottom of wp-login.php, which is a 302.
So the status code on POST /wp-login.php separates the thousands of failures from the handful of successes:
awk '$6=="\"POST" && $7 ~ /wp-login\.php/ && $9==302 {print $1, $4}' access.logCross-check every address by name
Now cross-check every IP in that list against the people who should be logging in. This is the single highest-value query in the whole list, and it takes one second to run.
A 302 from an address in a country none of your team is in, at 04:00, is the moment the incident started.
To see the brute force that preceded it, count login POSTs per IP per minute with awk '$6=="\"POST" && $7 ~ /wp-login\.php/ {split($4,t,":"); print $1, t[2]":"t[3]}' access.log | sort | uniq -c | sort -rn | head.
4. Googlebot that is not Googlebot
The user agent is attacker-controlled, and claiming to be a search engine is the oldest way to get past a crude block.
Google publishes the verification method: resolve the IP to a hostname, confirm it ends in googlebot.com, google.com or googleusercontent.com, then resolve the hostname back and confirm you land on the same address.
Both directions have to pass. The check is four steps per address.
- Pull every address whose user agent claims Googlebot:
grep -i 'googlebot' access.log | awk '{print $1}' | sort -u. - Reverse it with
host "$ip"and read the pointer record. - Accept only a hostname ending in
googlebot.com,google.comorgoogleusercontent.com. - Resolve that hostname forward again and confirm it lands back on the same address. Anything else prints as FAKE.
Why this matters even when the answer is boring
Some of what this prints is harmless scraping.
The reason to run it is the other direction: it tells you which log lines you are allowed to treat as real crawl evidence when you are trying to work out what Googlebot was served.
That matters when the problem is content served only to crawlers, which is the case I wrote up in the scanner said clean while the site was serving spam to Googlebot.
5. The pivot: an IP that collected 404s and then got a 200
Scanners probe hundreds of paths and get nothing. The one that matters is the address whose probing turned into a success.
One awk pass counts 404s and 2xx responses per IP into two arrays, then prints only the addresses that appear in both, sorted by the 404 count.
What the two numbers mean together
A visitor who read four articles produces zero 404s. A scanner produces four hundred 404s and zero successes. The row you care about has both numbers high, and then you go and read every request that IP made in order.
6. User enumeration that worked
Two queries: awk '$7 ~ /wp-json\/wp\/v2\/users/ && $9 ~ /^2/ {print $1, $7, $9}' access.log, and the same shape against $7 ~ /\?author=/ with $9 ~ /^30/ for the redirect.
What enumeration buys an attacker
The REST users route and the ?author=N redirect both hand out real usernames. On their own they are a nuisance.
Preceding a burst of login POSTs from the same IP, they are the first half of the attack, and they tell you which account to check first.
7. Published indicators from real incidents
When a disclosure names a path, a parameter or an address, put it straight into a grep. From incidents published in the last two years: grep -F -e 'gf_api_token' -e '94.156.79.8' -e '185.243.113.108' access.log.
Where those three strings come from
The first is from the Gravity Forms notice of 11 July 2025. The second is the exfiltration server Wordfence published on 24 June 2024 for the five compromised WordPress.org plugins.
The third is one of four addresses Rocketgenius listed as related to the malicious package code. These are cheap to check and they cost nothing when they return empty.
What is noise, and how to stop reacting to it
Every publicly reachable site on the internet receives a constant stream of the following, and none of it means you have been hit:
GET /.env,/.git/config,/wp-config.php.bak,/backup.zip,/phpinfo.php– mass scanning for misconfiguration.POST /xmlrpc.phpin bursts –system.multicallpassword guessing, which has been running against every WordPress site for a decade.- Login POSTs from residential proxy ranges returning 200 forever.
GET /autodiscover/autodiscover.xml,/owa/,/vendor/phpunit/– probes for software you are not running.
The response code is the finding
The probes are not the finding. The response code is. Volume tells you nothing on its own, and a security plugin that emails you about every one of these trains you to ignore it.
Filter your view by status first, with awk '{print $1, $9}' access.log | sort | uniq -c | sort -rn | head -20.
Then read only the rows where an unfamiliar address has a 2xx or a 302.
What the log will not tell you
Being clear about the limits keeps you from trusting a null result.
No request bodies
No request bodies. You see that a POST happened and what it returned. You never see what was posted.
A web shell driven entirely through POST parameters leaves you a path and a byte count, and the byte count is often the only clue about whether it did anything.
Nothing that did not arrive over HTTP
Nothing that did not arrive over HTTP. A payload living in wp_options and fired by WP-Cron on a real visitor’s page load produces a request from an innocent visitor.
So does code that runs on every admin page.
In the BdThemes compromise Wordfence published on 8 August 2026, the malicious script fired inside the administrator’s own browser on every dashboard load, from a poisoned remote JSON response, with no file changed on disk.
From the server’s point of view that is your admin using your dashboard.
Anything already rotated away
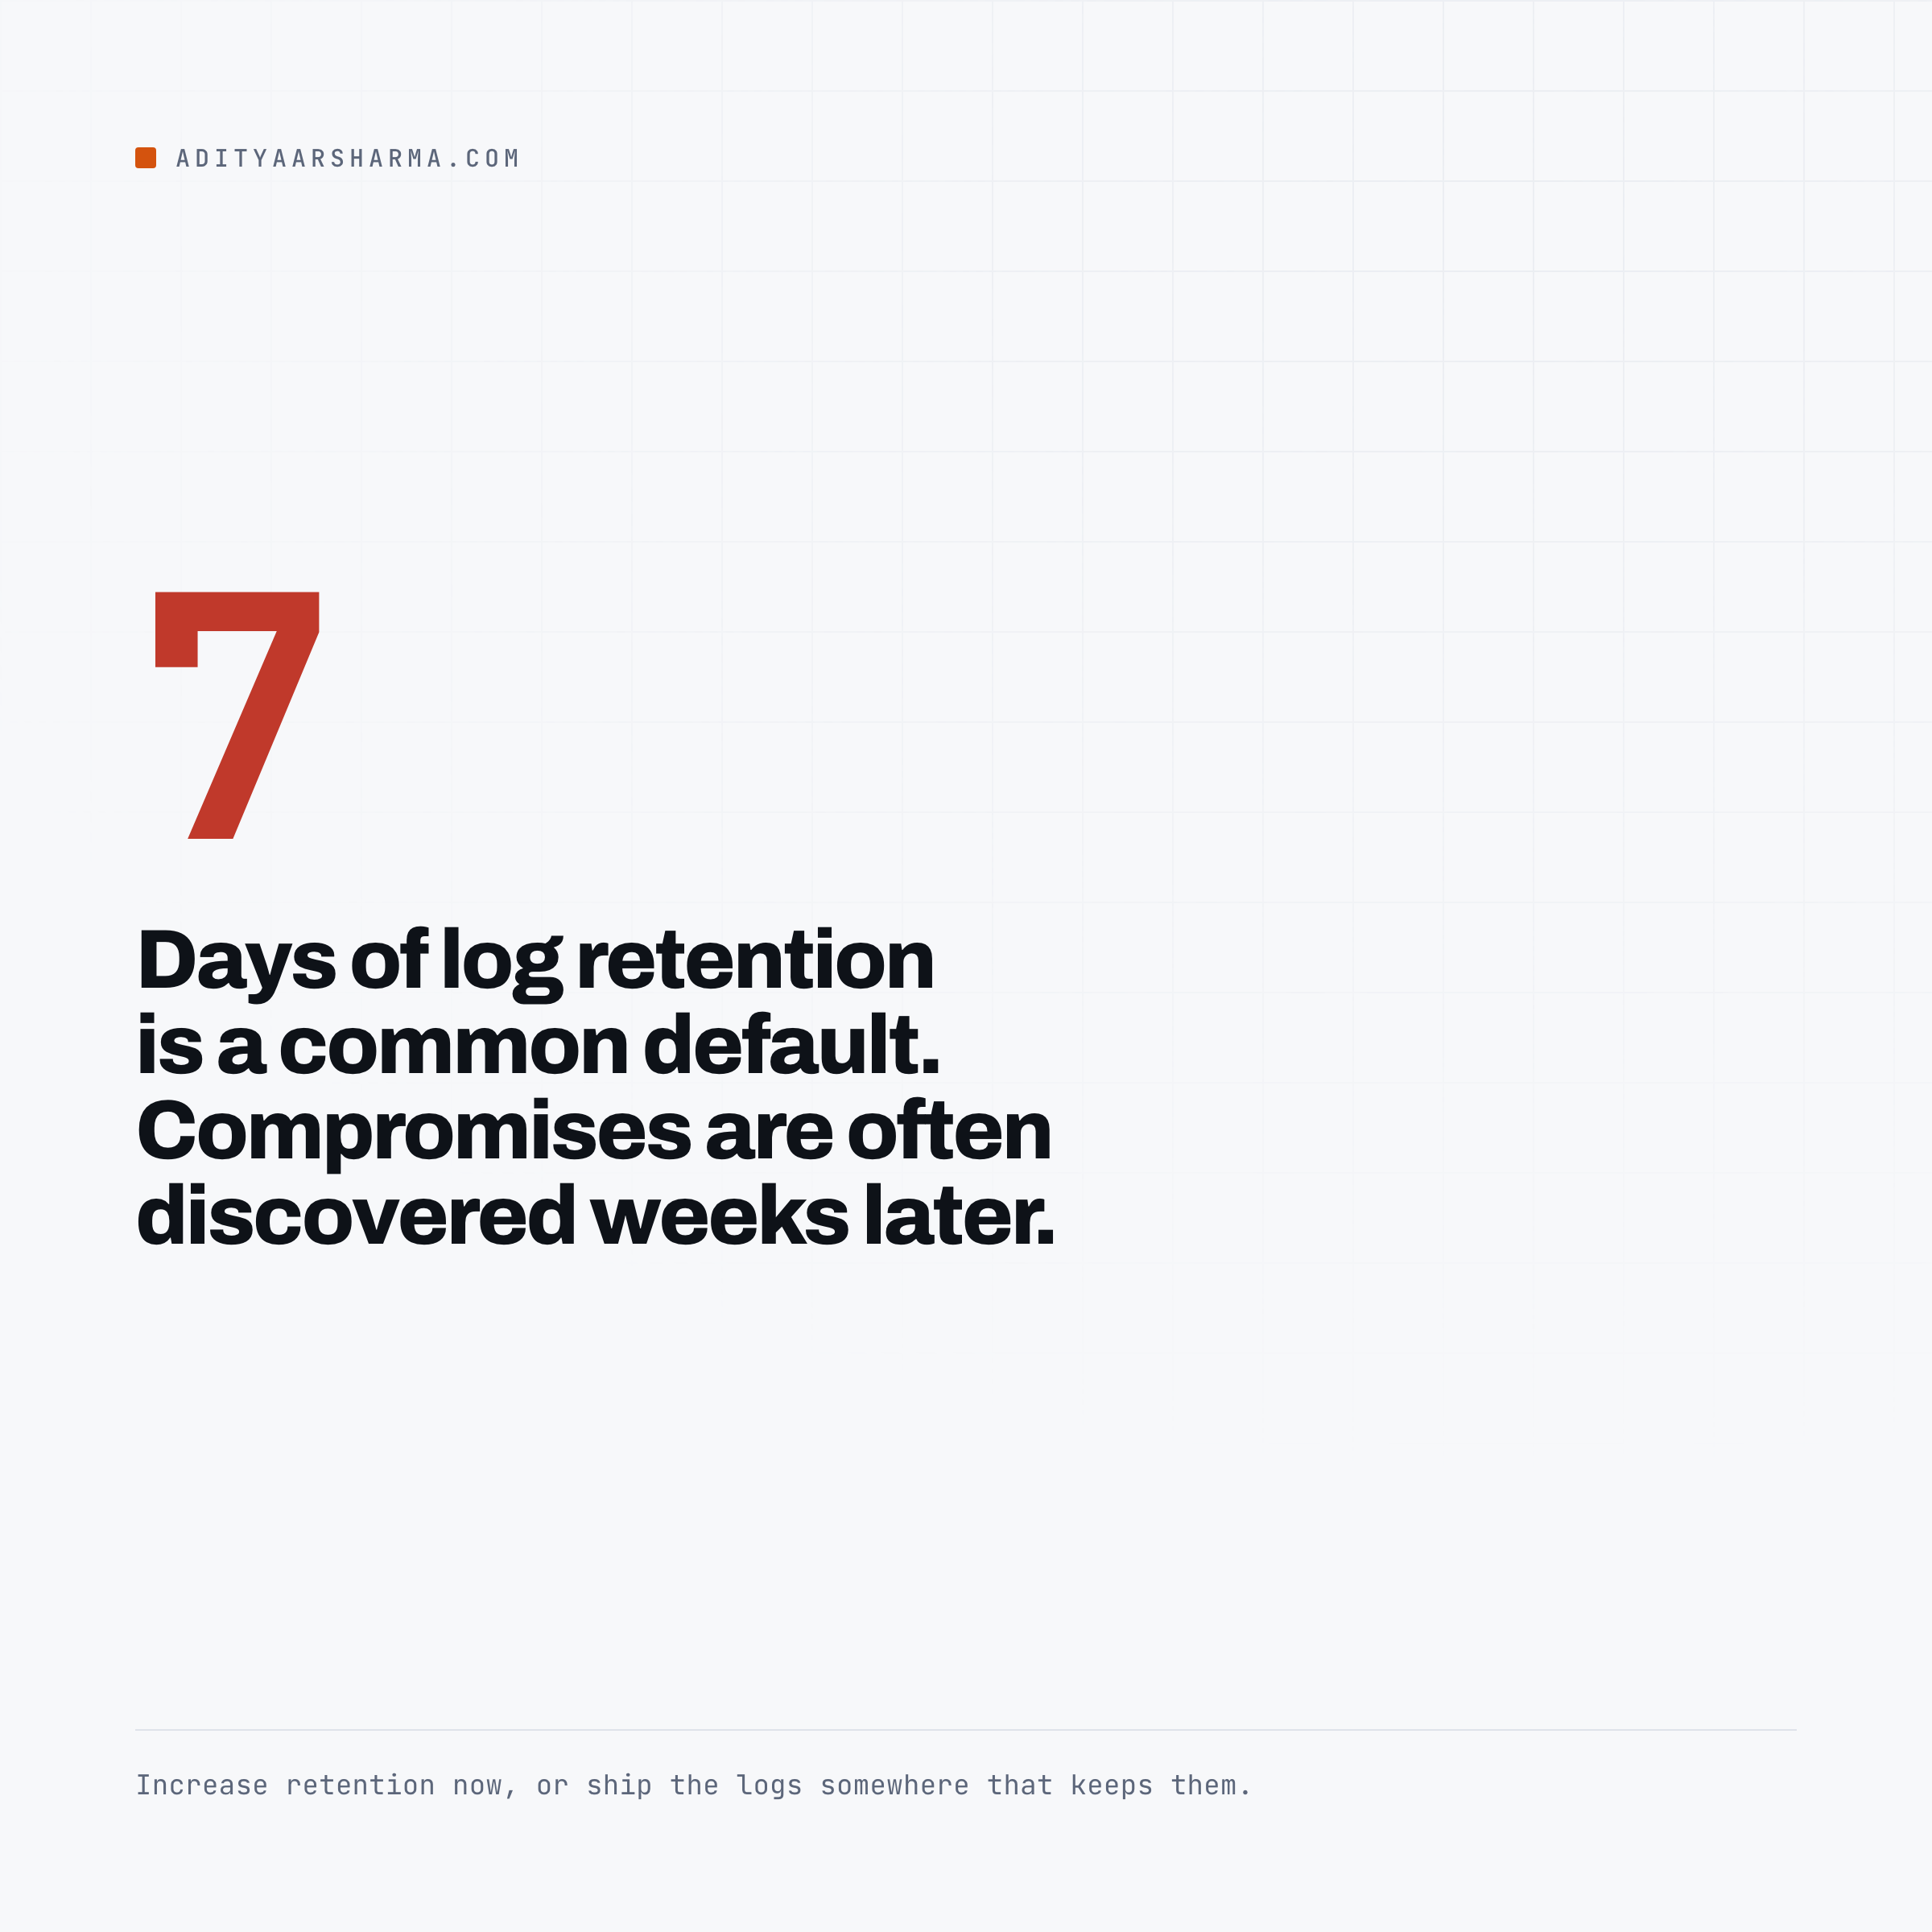
Anything already rotated away. Seven days is a common default. Compromises are often discovered weeks later. Increase retention now, or ship the logs somewhere that keeps them.
The real client IP behind a proxy
The real client IP, if you are behind a proxy. Cloudflare and most CDNs put the origin address in CF-Connecting-IP or X-Forwarded-For.
If $1 in your log is always a proxy address, every IP-based query above is measuring the wrong thing until you add that header to your log format.
Where this fits
Logs are the second half of a pair. The scanner tells you about files, the log tells you about events, and neither one is sufficient.
If the thing you are chasing is form submissions rather than intrusions, the diagnosis runs differently and I have covered it in why you still get spam despite Google reCAPTCHA.
If the harvesting is aimed at published addresses, protecting emails from scraping with Cloudflare is the cheaper fix.
And when a 302 in your login log turns out to be someone else, the account hygiene question comes first, which is the argument in YubiKey versus password managers.
When this stops scaling by hand
Across more than a handful of sites, doing this by hand stops scaling, and a management layer that centralises log and uptime data starts paying for itself. I compared the options in the eight WordPress management tools.
Do this today
Run query 3. One line, against your current log plus everything rotated. Print every 302 on POST /wp-login.php and the IP that produced it, then account for every single address on that list by name.
If you cannot name one, you have found something, and you now have a timestamp to work outwards from.
More on wordpress security
- Why WordPress Malware Scanners Miss Cloaked Spam, and How to Actually Check
- Application Passwords in WordPress: The Security Model, and Where It Leaks
- WordPress Plugin Supply Chain: What Actually Happened in the Documented Incidents
Resources
- Apache log files – the combined log format, field by field.
- nginx ngx_http_log_module – the default
combinedformat and how to add headers to it. - Verify requests from Google crawlers and fetchers – the reverse DNS procedure used above, plus the published IP ranges.
- Gravity Forms security incident notice, 11 July 2025 – the source of the request signature and the IP list.
- Wordfence on the WordPress.org plugin compromise, 24 June 2024 – the exfiltration IP and the injected admin usernames.
- My site was hacked – the official WordPress cleanup FAQ.